Abstract
This paper aims to explore the impact of climate change on underwater and coastal sites over the past few decades, with a specific focus on the Chekka area in North Lebanon. Given its rich maritime archaeology potential, this region has become a focal point, especially with the ongoing developments posing a threat to cultural resources. Detecting climate changes necessitates extensive measurements from various sources globally, including land stations, ships, and satellite imagery. In this study, we concentrate on changes in sea surface temperature (SST) over the last 20 to 40 years. The analysis heavily relies on satellite imagery, with a primary focus on Landsat 8, equipped with two bands of the thermal infrared sensor (TIRS), and Landsat 7, which carries the Enhanced Thematic Mapper Plus (ETM+) sensor, and also Landsat 5 TM. Utilizing QGIS for the calculation of SST, our findings reveal a noteworthy increase of 1° in sea surface temperature over the past two decades. This observation underscores the significance of ongoing climate change and its potential repercussions for the underwater and coastal cultural heritage in the Chekka area and its suburbs.
Keywords
Climate Change, Sea Surface Temperature, Satellites Imagery, UCH, Sea Surface Salinity
1. Introduction
The most pressing challenge we face today is climate change and its far-reaching impact on our lives. Across the globe, concerted efforts are underway to address the threat of climate change. Countries and international communities are working together to formulate solutions and establish agreements that serve as measures to mitigate the severity of this challenge.
Climate, in its broadest sense, can be categorized into two levels: local and global. Local climate pertains to the specific weather patterns of a particular country or region, while global climate encompasses the collective climate of our planet, Earth. The climate is an interconnected system, comprising various components such as the sun, oceans, forests, and human activities
. Each of these elements plays a critical role in maintaining the Earth's ecosystem, and any threat to one component can potentially induce changes in the global climate.
Recognizing the interdependence of these components highlights the delicate balance that sustains the Earth's climate. Whether it be alterations in solar radiation, disruptions in ocean currents, deforestation, or human-induced changes, any impact on these components can reverberate throughout the entire climate system. Addressing climate change requires a holistic understanding of these intricate relationships and a collective commitment to preserving the stability of our planet's climate.
The most compelling evidence of climate change lies in the changes in carbon dioxide (CO
2) concentration. As all parts of the globe are interconnected, fluctuations in CO
2 levels contribute to alterations in air temperature, commonly referred to as global warming. The recognition of these changes requires an extended period, with scientists tracing these shifts back to the early 19
th century
| [10] | Kennedy V., et all., 2002, Coastal and marine ecosystems and global climate change, Journal of Environment, Pew Centre on Global Climate Change. |
[10]
.
Anthropogenic activities, primarily driven by human actions, emerge as a significant factor influencing these changes in the global climate. The Intergovernmental Panel on Climate Change (IPCC), in its report spanning 2014-2015, describes how human activities have contributed to reshaping ecosystems and life on Earth.
“Human influence has been detected in warming of the atmosphere and the ocean, in changes in the global water cycle, in reductions in snow and ice, and in global mean sea level rise; and it is extremely likely to have been the dominant cause of the observed warming since the mid-20th century.”
Perhaps the most prominent results of climate change lie in the change in sea surface temperature. Sea surface is on direct contact with atmosphere. The sea surface is a dynamic and complex environment influenced by various factors, including wind, temperature, salinity, currents, and atmospheric conditions
. The SST is the temperature of water close to oceans and seas surface influenced by the changes in the atmosphere
| [15] | Splading M., 2011, Perverse Sea change: underwater culture heritage in the ocean is facing chemical and physical changes, culture heritage & art review. |
[15]
.
Detecting changes in sea surface temperature is a crucial aspect of monitoring climate variations and their impact on marine environments. This process involves utilizing a combination of measurement techniques and technologies to analyze temperature shifts over specific time periods. Estimating global average surface temperature increase requires careful analysis of millions of measurements from around the world, including from land stations, ships, and satellites imageries
| [4] | Bourouhou I., Salmun F., 2021, Sea surface temperature estimation using remotely sensed imagery of Landsat 8 along the coastline of Tangier - Ksar Sghir region, The International Conference on Innovation, Modern Applied Science & Environmental Studies (ICIES2020), Vol 234. |
[4]
. The progress made in satellite measurement of SST has greatly expanded our ability to monitor and understand ocean temperature patterns on a global scale. These advancements contribute to a more comprehensive and nuanced comprehension of Earth's oceans and their dynamic behaviors.
SST is a crucial parameter for studying and understanding the marine environment, including its impact on marine cultural heritage both underwater and along the coasts. The temperature of the sea surface influences a wide range of ecological and geological processes.
Kokal et al. (2022)
| [11] | Kokal Tuzcu A., Ismailoglu I., 2022, Detection of surface temperature anomalies of the Sea of Marmara, Journal of Advances in space research, vol 71, 2023, pp 2996-3004. |
[11]
examined the SST and anomalies at the Marmara Sea in Turkey over the past 32 years. The study depends on the use of different satellites imagery as the Landsat-8 and Sentinel-3, where the sensor of satellites enables to measure a large area of temperature of the sea by the thermal infrared region of electromagnetic spectrum. The Landsat program is the longest-running enterprise for acquisition of satellite imagery of Earth. It was initially named Earth Resource Technology Satellite. Usually, the maps or images from Landsat are divided into scenes to make them easier and free to download. There are different developed versions from Landsat, the last one being Landsat8, launched in 11 February 2013, which uses 11 bands with 30 meters high spatial resolution
. They are launched under the mission of The National Aeronautics and Spaces Administration (NASA) of USA and US Geological survey USGS. In addition, the study depends on the use of NOAA’ Climate Data Records (CDR) which provides global and daily measurement of SST and temperature anomalies bands with spatial resolution of 0.25° (27830m) since 1981. The result indicates increasing of SST while the highest mean temperature was recorded in 2020. During the last 32 years, approximately 2°C variation of SST observed and the STA was detected in the recent year during the spring season.
The study of SST is particularly relevant to the preservation of marine cultural heritage, including submerged archaeological sites. Changes in water temperature can influence the degradation rates of underwater artifacts and structures. The projections on sea-level rise provided by the Intergovernmental Panel on Climate Change (IPCC) in their 2019 report indeed highlight the potential impact on coastal areas. According to the report, the sea level is expected to rise by around 1 meter across more than 95 percent of the world's oceans, with rates of progression ranging from 4 to 15 millimeters per year. Higher sea levels can exacerbate the impact of storms, leading to more severe storm surges and flooding in coastal regions. This poses significant risks to communities and the national maritime boundaries between countries, infrastructure, culture heritage and archeological sites, also it will impact the ecosystems along coastlines
| [13] | Perez-Alvaro, E. 2016, Climate change and underwater culture heritage: Impacts and challenges, Journal of Culture Heritage, Vol 21, Pp 842-848. |
[13]
.
The acidity of ocean and sea is changing, here the global PH changes from 2000 to 2018 provided by Copernicus environment monitoring service, this is leading to double the chemical reaction on the underwater artifact especially the corrosion of metal shipwreck laying on the seabed
.
In 2017, a huge iceberg broke away from the Antarctica landmass. Declining ice cover also leads to rise in sea levels. This event was closely monitored by satellite instruments, including those on the Copernicus Sentinel-3 mission which is a European program. Its primary aim is to monitor oceans and coast lines, and also it equipped by instrument that can measure the sea level changes, SST and other ocean parameter
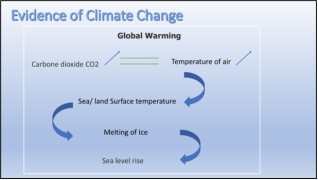
. Increasing od sea level led to put culture heritage on coastline under threat of erosion and it could be underwater with time. Climate change can have significant impacts on archaeological sites on land, coastal sites, and also the UCH, affecting their preservation, accessibility, and overall condition (
Figure 1).
Figure 1. Illustration of climate change impact on UCH 'Copyright: Author'.
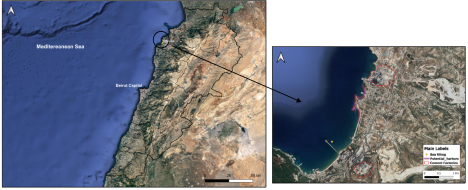
In this paper, we are going to detect the changes of SST at Chekka area from North Lebanon over the past 30 years (
Figure 2). And that’s to prove how human activities led to change the ecosystem at this area. Chekka was covered by salt marshes on the coastlines and agricultural olive land. These conditions of the town have been changed after the construction of the first cement factory in the area dated back to 1931 The Holicem Factory, followed by another company after two decades. The construction of Holicem factory on the Bay of Chekka led to change the morphology and components of the shoreline in this area, that because of the construction of artificial jetty which extends 750m into the sea
. In addition, a maximum erosion was recorded at 81m inland with majority of erosion occurring between 1970-1994, and also some accretion reaching maximum of 94m around the jetty
. The coastline changed becoming heavily populated and many agricultural areas vanished
. In addition, Chekka has high potential of archeology on land and underwater. The village of Chekka has been identified as ancient Šigata in the Amarna letters (EA 76, 98 and 104). Chekka provides two potential locations for harbors, one to the north and one to the south of the headland of Chekka and its harbor is mentioned when it was occupied by the Arwad’s fleet
| [17] | Safadi C., 2014, Bronze age and Iron age Levantine harbour: an evaluation of their maritime accessibility and protection, [Thesis], [Southampton University |
[17]
. An archeological survey mission in 1974, reveals some maritime artifact as the few anchors: implies the presence of historical or archaeological artifacts. Ballast mound with concreted sherds which suggests the presence of a mound, possibly containing ballast material and concrete artifacts. These artifacts may indicate historical maritime activities, such as the anchoring of ships and the presence of vessels carrying ballast material
| [17] | Safadi C., 2014, Bronze age and Iron age Levantine harbour: an evaluation of their maritime accessibility and protection, [Thesis], [Southampton University |
[17]
. In addition, the geomorphological context as the sandy-bottom and the shallow water facing the basin of Ras Chekka made the site during the antiquity as special and helpful to be a natural harbor.
In summary, a focused study on sea surface temperature, sea salinity, and changes in coastlines in a specific area of the Lebanese coastlines can offer valuable insights into the impacts of climate change. The outcomes can guide conservation efforts, support adaptive management, and serve as a foundation for broader regional and global comparisons.
Figure 2. Lebanon Map presenting Chekka case study, North Lebanon 'Copyright: Author'.
2. Materials and Methods
Recently, remote sensing is hugely used in marine studies and analysis including satellites imagery and marine geophysics tools
. Satellites imagery plays a crucial role in studying maritime archeology by providing a valuable and efficient means of investigating underwater and coastal environment. It a way to identify and detect sites because it offers a large scale of images which enable researchers to determine the archeological potential. and also, the use of thermal satellites helps monitor changes in coastlines, including erosion and submersion
. Recently and because of developing technologies, satellites are equipped with thermal sensors to capture radiance from the surface of land, seas and all water body. This is crucial for understanding oceanic and climatic patterns, as well as monitoring environmental changes. Today, many studies depend on the use of satellites imagery and other remote sensing technique to monitor climate change through decades. The consequence of climate change reveals changes on surface temperature of water bodies, and sea salinity of oceans and seas.
The core of all GIS is to capture, store, develop and analyses different types and sources of data including a real-time information in reason to respond on specific question or to solve natural disaster
| [18] | Milenkovic M., Kekic D, 2017, Using GIS in emergency management, SINTEZA ed., International scientific conference on ICT and E-Business related research, 2016. |
[18]
. The types of data used are related to its real location on the surface of Earth
| [18] | Milenkovic M., Kekic D, 2017, Using GIS in emergency management, SINTEZA ed., International scientific conference on ICT and E-Business related research, 2016. |
[18]
. That’s applying on measuring the changes of temperature and digitizing the coastlines which is converting geographical data into digital form.
This paper depends on the use of Landsat collection satellites to measure the temperature and salinity on large scale of Chekka sea and on land. This method is very helpful and useful to detect the changes during the last decades of same area. That’s because of thermal band which capture the radiance and reflectance of material and water.
Landsat is a series of Earth-observing satellite missions jointly operated by USGS and NASA. The Landsat program has been providing a continuous record of Earth's surface since the launch of the first Landsat satellite in 1972. The primary mission of Landsat is to collect multispectral imagery of the Earth's surface for various applications, including land use, environmental monitoring, and resource management
| [4] | Bourouhou I., Salmun F., 2021, Sea surface temperature estimation using remotely sensed imagery of Landsat 8 along the coastline of Tangier - Ksar Sghir region, The International Conference on Innovation, Modern Applied Science & Environmental Studies (ICIES2020), Vol 234. |
[4]
. Landsat satellites capture imagery in multiple spectral bands, including visible, near-infrared, and thermal infrared. These satellites sensors capture data in multiple bands, allowing for multispectral analysis, this capability is particularly useful for environmental changes including the sea surface temperature and salinity (Reul N, et all., 2020). The data used in this study and analyzed are both Landsat 7 and 8 (
Table 1). The Landsat 8 is working on infrared radiometer band 10 and 11 provides huge data covered the Lebanese land. The sensors deployed on satellites imagery Landsat8 Operational Land Imager (OLI). Through TIRS we can measure the land temperature in two thermal bands with a new technology that applies quantum physics to detect heat. The process worked by measuring the amount of infrared light emitted from the earth and the radiant temperature of water bodies
. Both sensors are covered the landmass with 30m of resolution (visible, NIR, SWIR); 100 meters (thermal); and 15 meters (panchromatic). The primary features on Landsat 7 include a panchromatic band with 15-meter spatial resolution, an onboard full aperture solar calibrator, five percent absolute and the TIRS instruments allow to assess water parameter efficiently radiometric calibration, and a thermal infrared channel with a four-fold improvement in spatial resolution over Thematic Mapper
. Landsat 7 satellite is equipped with Enhanced Thematic Mapper Plus (ETM+), the successor of TM. The spectral bands of ETM+ are essentially the same seven bands as TM, added panchromatic band 8, with a high resolution of 15-meters
. The same thermal infrared bands as Landsat 8 are used to detect heat for calculating sea surface temperature and also, the methodology depends on the use of Landsat 5 equipped with Thermal Mapper where wave length of band 3 visible red ranging between (0.63 - 0.69 µm) 30 m, and the band 4 near infrared wave length ranging between (0.76 - 0.90 µm) 30 m using of old Landsat series helped to find more ancient map of Chekka where Landsat 5 delivered Earth imaging data for nearly 29 year and more, here it’s used for finding images of Chekka dated back to 1985.
Table 1. Dataset used for measuring SST and SSS.
Landsat ID | Path/Row | Dated | Season |
Landsat 7 ETM+ L1TP_174036_19990722_20211204_02_T1 | 036/174 | July 1999 | Summer |
Landsat 8 LC08_L1TP_174036_20240312_20240312_02_RT | 036/174 | Jan 2024 | Winter |
Landsat 8 LC08_L1TP_174036_20230801_20230805_02_T1 | 036/174 | Aug 2023 | Summer |
Landsat 5 TM LT05_L1TP_174036_19850128_20200918_02_T1 | 036/174 | Jan 1985 | Winter |
Landsat 8 LC09_L1TP_174036_20220211_20230428_02_T1 | 036/174 | Feb 2022 | Winter |
QGIS, a geographic information system software, plays a crucial role in processing and analyzing the satellite data. Through this platform, the aim of this case study is to calculate and visualize the changes in SST over the last two decades in reason to explore also the changes of sea salinity at Chekka area where the cement factories, that to present how the anthropogenic activities affect in negative way on sea morphology and components and geology where the coastlines changed because of new constructions and because of ancient erosion. The main coordinate system used is the WGS84 UTM zone 36N, ESPG: 32636 which covered the Lebanese land. The WGS84 datum provides a standardized reference for expressing locations on the Earth's surface, and the purpose of UTM is to provide a mapping system that minimizes distortion within each zone.
The use of remote sensing and geographic information system GIS are useful technique for many case studies need a lot of interpretation and post-processing of data gathered. The SST is the first variable of ocean to be studied by satellites imagery through the infrared and microwaves radiometer on polar orbiting satellites and from the infrared radiometer from geostationary space-craft
| [8] | Decheng Zhou, et all., 29 Dec. 2018, Satellite Remote Sensing of Surface Urban Heat Islands: Progress, Challenges, and Perspectives, journal of Remote sensing, vol 11, p 48. |
[8]
. Steps of measuring SST on raster calculator
| [2] | Advan U., Jovanovska G., 2016, Algorithm for automated mapping of land surface temperature using Landsat 8 satellites data, Journal of Sensor 2016, Article ID 1480307, http://dx.doi.org/10.1155/2016/1480307 |
| [11] | Kokal Tuzcu A., Ismailoglu I., 2022, Detection of surface temperature anomalies of the Sea of Marmara, Journal of Advances in space research, vol 71, 2023, pp 2996-3004. |
[2, 11]
:
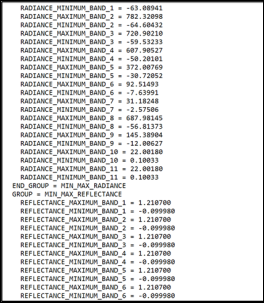
The first step started by converting raw image of Landsat into top of atmosphere (TOA) spectral radiance which is the amount of radiation coming from the area.
Where ML represents the bands specific multiplicative rescaling factor, Qcal represents the quantized and calibrated standard product pixel values for Band 10 and AL represents the band specific additive rescaling factor provide in the metadata profile (MLT) (
Figure 3).
Figure 3. MLT profile of Landsat image 'Copyright: Author'
Calculating top of atmosphere reflectance which provides the ratio of radiation reflected to the incident solar radiation on a given surface. The results depend on the property pf material itself. The reflectance is applied on the two OLI band 5and 4 for Landsat 8, and the process applied on band 6 IR, band 4 (NIR) and band 3 (red visible) for Landsat 7. This is in order to use them in calculating the brightness temperature.
Where Ρλ represents the raw bands to top-of-atmosphere reflectance, Mρ provides an additive rescaling factor
Qcal = DN
ѲSE = Solar elevation angle
The brightness temperature is the measurement of radiance of the microwave radiation traveling upward from the top of atmosphere to the satellites. It calculated using the equation below where K1 and K2 provide a constant value for TIRS. The result of equation will return the Kelvin into °C.
The process continues in progression to find the emissivity Ɛ of each pixel in order to convert the brightness temperature into land surface temperature or in the other hand the sea surface temperature. The emissivity is originated from the value of Normal Difference Vegetation Index NDVI which is provided by the visible red and near infrared bands. The method used here is on Advan and Jovanovska 2016 which is the same used for calculating LST. The result returns the maximum and minimum values of NDVI which are used in finding the proportion of vegetation in reason to rescale the NDVI between values representing bare soil and total vegetation.
This paper is also going to detect the changes in SSS which refers also to Normalized Difference Salinity Index (NDSI), and that’s to find the relation between SSS and SST due to climate change. There are two methods for calculating the salinity of seawater, the in-situ method which depends on collecting sample from seas, oceans or rivers and analyze in specific laboratory, and the indirect method which depends on using the remote sensing as the Landsat 8 and 5 where are using in our study
| [21] | Muhsi M., Sukojo B. M., Taufik, M., Aji, P., & Jaelani, L. M. (2022) Estimation of Sea Surface Salinity Concentration from Landsat 8 OLI Data in the Strait of Madura, Indonesia. Forum Geografi. Vol. 36, No. 2. |
[21]
. Indeed, accurate retrieval of SSS from satellite images is highly dependent on the accuracy of surface reflectance obtained through atmospheric correction algorithms and the reliability of parameter retrieval algorithms
. Through the microwaves radiometer operated at frequency 1.4 GHz, SSS are available since 2010 with regular repeat global coverage
| [25] | Young Jun Kim, Daehyeon Han, Eunna Jang, Jungho Im & Taejun Sung (2023) Remote sensing of sea surface salinity: challenges and research directions, GIS science & Remote Sensing, 60: 1, 2166377, https://doi.org/10.1080/15481603.2023.2166377 |
[25]
. The calculation of brightness temperature and emissivity are related to the dielectric and geometric characteristic of the sea surface
| [5] | Boutin, J., Reul, N., Koehler, J., Martin, A., Catany, R., Guimbard, S., et al. (2021), Satellite-based Sea surface salinity designed for ocean and climate studies. Journal of Geophysical Research: Oceans, 126, e2021JC017676. https://doi.org/10.1029/2021JC017676 |
[5]
. The main unit is ppt (part per thousand) which refers to the quantity of salt dissolved into the sea
. The use of Landsat series was essential to find the changes of the last 20 years at Chekka area and how this change is relevant to climate change. The main equation used is:
Band 2 is representing the blue band in Landsat 8 with 30m resolution and 0.450-0.515 wavelength, this band is useful for bathymetric mapping, distinguish soil and vegetation, while the Near infrared band 5 had 0845.-0.885 wavelength represent the biomass content and shorelines
| [26] | Yang I., Acharya T., 2015, Exploring Landsat 8, Journal of International Journal of IT, Engineering and Applied Sciences Research (IJIEASR) ISSN: 2319-4413 Volume 4, No. 4, pp 4-10. |
[26]
.
3. Results
This section describes the results obtained from the study using satellite imagery for marine studies and maritime archaeology, the results depend on comparison to understand the changes in SST. The methodology involved processing the data in QGIS to generate thermal maps showing temperature and salinity quantities for each pixel. Additionally, the coastline of Chekka was digitized to analyze changes in morphology and shape due to sea filling and natural coastal erosion caused by sea level changes and storms.
The study compared temperature data between summer and winter seasons spanning over 20 to 40 years. The maps and temperature profiles illustrate noticeable changes in temperature along the coastline and land, particularly near cement factories and areas with high population densities. These changes are attributed to factors such as toxic gas emissions, coastal development, and construction without adequate consideration for ecosystem preservation.
Overall, the results highlight the significant impact of human activities and environmental changes on coastal areas, underscoring the importance of sustainable development practices and ecosystem conservation in maritime environments.
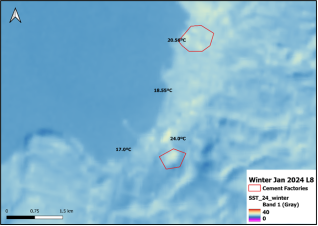
Winter Season
January is the coldest and wettest month in Lebanon, rainfall is common throughout the country, with coastal areas receiving moderate rainfall and mountainous regions experiencing heavier precipitation. In general, the average temperature for coastal area is ranging between 10°C to 17°C.
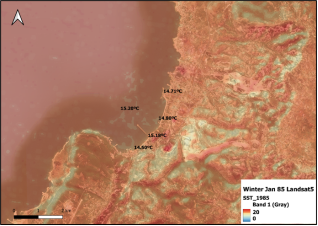
Figure 4. SST, January 2024 'Copyright: Author'.
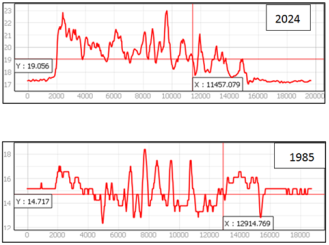
Figure 4& 5 present the SST and the coastal temperature of Chekka between 2024 and 1985, this is describing the changes over the 40 years. Today, the temperature on the coastline is 17°C to 20°C, it becomes higher next to the cement factories where the yellow spot indicates the higher temperature and the emission of toxic gases. Looking at temperature during 1985, it wasn’t beyond 15°C. These noticeable changes in degree are describing through the temperature profile of both years in Graph 1, where the maximum degree in 1985 was 18°C, and today it is 23°C, in addition the average temperature increase from 14°C to 19°C.
Figure 5. SST, January 1985 'Copyright: Author'.
Figure 6. Temperature Profile, 2024 vs 1985 'Copyright: Author'.
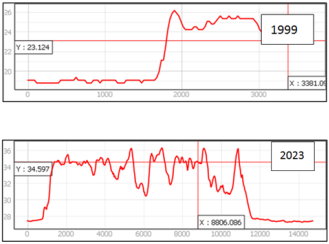
Summer Season
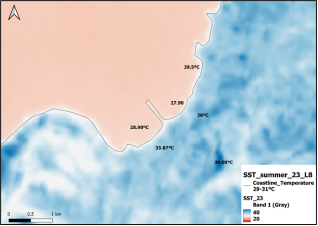
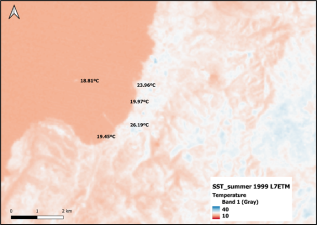
In Lebanon, the summer season typically extends from June to August, offering warm to hot weather with plenty of sunshine especially in coastal areas and the Bekaa Valley (East of Lebanon). Generally, the temperature in those months is ranging between 25°C to 35°C. The results from the thematic maps (
Figures 6 & 7) indicate a different result where in 1999 the degree varied between 19 to 23°C but today the temperature increase to reach 28°C on the coast and 35°C next the factories and on the mountains. This change is also described through the profile of temperature, the maximum degree was 26°C during 1999 but today it reaches 36°C and more, while the average increases from 23°C to 34°C (Graph 2). This changes in temperature are because of emitting toxic gas from factories and decrease space of vegetation in Chekka.
Figure 7. SST, June 2023 'Copyright: Author'.
Figure 8. SST, July 1999 'Copyright: Author'.
Figure 9. Temperature Profile, 1999 Vs 2023 'Copyright: Author'.
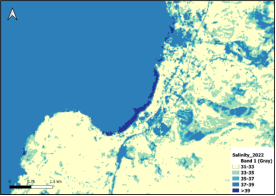
Salinity during the last 20 year
Perhaps the most significant result is the changes in salinity on the coast. It’s the quantity of salt dissolved in water, salinity is typically expressed in parts per thousand (ppt) or practical salinity units (PSU) [1, 6-25]. Measuring salinity is essential for understanding various oceanographic processes, and the distribution of marine life, it also affects the underwater resources by increasing corrosion of shipwreck made from metal, in addition it supports different type of marine organism which led to damage the submerged features.
Figure 8 presents the salinity during 2022, where the coastline salinity is ranging between 37-39 psu, it passed the normal average. This putted the coastline under threat of high percentage of corrosion and changes of marine environment in Chekka. While the average salinity of seawater is approximately 35 parts per thousand (ppt), which is equivalent to 35 grams of dissolved salts per kilogram of seawater. The results of climate change in Chekka exceed the normal average of salinity. The increasing of salinity affects the dynamic of sediment of the seabed and around the underwater sites, in addition it changes the type of marine biological life and support different algae and invertebrates where all of them are threaten and disturbed the submerged features and structures.
Figure 10. Quantity of salinity in Chekka and suburbs 'Copyright: Author'.
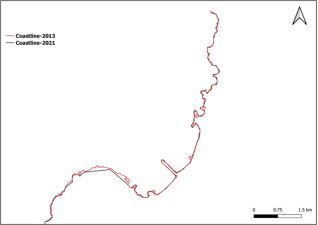
Figure 11. Digitizing changes due to erosion 'Copyright: Author'.
Coastline changes
Some changes are notice during the last decades, those changes are back to sea filling and accretion process on the coastlines of Chekka and its suburbs (
Figure 9), in addition, changes in climate can change the coastal dynamic and increase the level of erosion due to storm and unusual tides. The erosion of the sandy bank of chekka reaches 79000 m
2, this led to change the marine biodiversity and the morphology of coastline
. Erosion led to lost the natural morphology of coastline in Chekka which was already mentioned in ancient resources, it was considered as natural basin and used as harbor. The erosion led to change the type of sediment and its circulation on the coast, this lead to create difficulties in studying and analyzing the sediment of ancient and archeological basins
.
4. Conclusions
The utilization of various satellite imagery equipped with thematic sensors to detect heat has provided valuable insights into the changes occurring in the environment. These findings underscore the growing urgency and responsibility to address global environmental changes, which pose significant risks to ecosystems and societies worldwide.
Through the analysis of the obtained results and comparison with data from other sites globally, it becomes evident that the submerged landscape, artifacts, and coastline of Chekka are susceptible to a range of impacts. These impacts include erosion and environmental changes, which may have adverse effects on the site and surrounding areas.
Given these observations, it is imperative to conduct further studies and missions to comprehensively understand the dynamics of the submerged landscape and artifacts in Chekka. Such endeavors will not only enhance our knowledge of the site but also inform strategies for mitigating and adapting to the environmental changes affecting it. Additionally, collaborative efforts involving interdisciplinary expertise and international cooperation will be essential in addressing these challenges effectively.
The changes of climate affect the circulation of oceans which have different negative impact on marine biodiversity and ocean nutrient distribution. Some species may thrive in new conditions as Teredo Navalis and Lyrodus Pedicellatus, both are living in warm water
| [13] | Perez-Alvaro, E. 2016, Climate change and underwater culture heritage: Impacts and challenges, Journal of Culture Heritage, Vol 21, Pp 842-848. |
[13]
. A new phenomenon is also noticed, the coral bleaching in different areas. According to the National Oceanic and Atmospheric Association, between 2014 and 2017 around 75% of the world’s tropical coral reefs experienced heat-stress severe enough to trigger bleaching
| [22] | NOAA, 2018, Scott M., Lindsey R., 2018, Unprecedented 3 years of global coral bleaching, 2014–2017, Edt. blunden J., Hartfield G., Eakin M., De La Cour J., accessed 22 March 2024, URL https://www.climate.gov/news-features/understanding-climate/unprecedented-3-years-global-coral-bleaching-2014%E2%80%932017 |
[22]
.
The interconnectedness between climate change and underwater cultural heritage (UCH), emphasizing the significant impact that climate change can have on maritime archaeological sites. By recognizing maritime archaeology as a crucial tool for understanding past climate patterns and human adaptation, you underscore its relevance in the context of current environmental challenges.
The focus on human interaction with aquatic environments throughout history, including ancient migration patterns and utilization of maritime resources, provides valuable insights into potential future scenarios. These studies not only inform our understanding of past civilizations but also offer valuable lessons for addressing contemporary climate-related challenges.
Furthermore, the importance of integrating cultural heritage into climate action is crucial. Cultural heritage not only serves as a repository of collective identity and knowledge but also highlights the potential risks that climate change poses to these invaluable resources. By incorporating cultural heritage considerations into climate mitigation and adaptation strategies, we can work towards safeguarding these sites for future generations while promoting sustainable environmental practices.
Abbreviations
CO2 | Carbone Dioxide |
CRD | Climate Data Records |
IPCC | Intergovernmental Panel on Climate Change |
LST | Land Surface Temperature |
NASA | National Aeronautics and Spaces Administration |
NDSI | Normalized Difference Salinity Index |
USGS | US Geological Survey |
UCH | Underwater Culture Heritage |
OLI | Operational Land Imager |
TOA | Top of Atmosphere |
SST | Sea Surface Temperature |
SSS | Sea Surface Salinity |
TIRS | Thermal Infrared Sensor |
ETM+ | Enhanced Thematic Mapper Plus |
Acknowledgments
My acknowledgement goes to the Honor Frost Foundation who’s supporting and funded my Diploma degree in Remote sensing and GIS at Ulster University, and for always supporting me in my career as archeologist and maritime archeologist.
Author Contributions
Sirine Saad El-Dine Ghiye is the sole author. The author read and approved the final manuscript.
Funding
This research paper is already presented during the 5th Asia-Pacific Regional Conference on Underwater Cultural Heritage, Asia Culture Centre, Gwangju South Korea, 13-18 November 2023, my participation funded by The National Research Institute of Maritime Cultural Heritage.
Data Availability Statement
The data of satellites imagery are available on: https://earthexplorer.usgs.gov/ https://www.copernicus.eu/en
Conflicts of Interest
The authors declare no conflicts of interest.
References
| [1] |
Ansari M., Akhoondzadeh M., 2019, Mapping salinity using Landsat 8 OLI satellites images (case study: Karun basin located in Iran), Journal of Advance in Space research 2019.
|
| [2] |
Advan U., Jovanovska G., 2016, Algorithm for automated mapping of land surface temperature using Landsat 8 satellites data, Journal of Sensor 2016, Article ID 1480307,
http://dx.doi.org/10.1155/2016/1480307
|
| [3] |
Abou Dagher M., et all., 2012, evolution of the coast of North Lebanon from 1962-2007: Mapping changes for the identification of Hotspots and for future management intervention, IV International Symposium “Monitoring of Mediterranean Coastal Areas”: Problems and Measurement Techniques At: Istituto di Biometeorologia (IBIMET), Consiglio Nazionale delle Ricerche (CNR), ITALY, accessed in 13 Jan 2024,
https://www.researchgate.net/publication/266262063_EVOLUTION_OF_THE_COAST_OF_NORTH_LEBANON_FROM_1962-2007_MAPPING_CHANGES_FOR_THE_IDENTIFICATION_OF_HOTSPOTS_AND_FOR_FUTURE_MANAGEMENT_INTERVENTIONS
|
| [4] |
Bourouhou I., Salmun F., 2021, Sea surface temperature estimation using remotely sensed imagery of Landsat 8 along the coastline of Tangier - Ksar Sghir region, The International Conference on Innovation, Modern Applied Science & Environmental Studies (ICIES2020), Vol 234.
|
| [5] |
Boutin, J., Reul, N., Koehler, J., Martin, A., Catany, R., Guimbard, S., et al. (2021), Satellite-based Sea surface salinity designed for ocean and climate studies. Journal of Geophysical Research: Oceans, 126, e2021JC017676.
https://doi.org/10.1029/2021JC017676
|
| [6] |
(PDF) Satellite‐Based Sea Surface Salinity Designed for Ocean and Climate Studies. Available from:
https://www.researchgate.net/publication/356454095_Satellite-Based_Sea_Surface_Salinity_Designed_for_Ocean_and_Climate_Studies
[accessed Jan 27 2024]
|
| [7] |
Chaturvedi A, (2020), Geospatial world advancing knowledge for sustainability, available at:
https://www.geospatialworld.net/blogs/satellites-for-monitoring-climate-change/#:~:text=NASA%20satellites%20ASTER%20and%20Landsat,polar%20ice%20caps%20over%20time
[Accessed 26 Jan 2023].
|
| [8] |
Decheng Zhou, et all., 29 Dec. 2018, Satellite Remote Sensing of Surface Urban Heat Islands: Progress, Challenges, and Perspectives, journal of Remote sensing, vol 11, p 48.
|
| [9] |
Global climate observation system, (2019), available at:
https://gcos.wmo.int/en/essential-climate-variables/sst
|
| [10] |
Kennedy V., et all., 2002, Coastal and marine ecosystems and global climate change, Journal of Environment, Pew Centre on Global Climate Change.
|
| [11] |
Kokal Tuzcu A., Ismailoglu I., 2022, Detection of surface temperature anomalies of the Sea of Marmara, Journal of Advances in space research, vol 71, 2023, pp 2996-3004.
|
| [12] |
Lange M., 2020, Climate Change in the Mediterranean: Environmental Impacts and Extreme Events, European Institute of the Mediterranean, In: IEMED 2020, URL
https://www.iemed.org/publication/climate-change-in-the-mediterranean-environmental-impacts-and-extreme-events/
|
| [13] |
Perez-Alvaro, E. 2016, Climate change and underwater culture heritage: Impacts and challenges, Journal of Culture Heritage, Vol 21, Pp 842-848.
|
| [14] |
Reul N, et all, 2020, Sea surface salinity estimates from spaceborne L-band radiometers: An overview of the first decade of observation (2010–2019), ed. Menghua Wang, Remote sensing of environment, vol 242, accessed 13 Jan 2024,
https://www.sciencedirect.com/science/article/pii/S0034425720301395?via%3Dihub
|
| [15] |
Splading M., 2011, Perverse Sea change: underwater culture heritage in the ocean is facing chemical and physical changes, culture heritage & art review.
|
| [16] |
Ghiye S., “Potential Climate Change Threats to underwater cultural heritage,” Asia Pacific Regional Conference on Underwater Cultural Heritage Proceedings,
https://apconf.omeka.net/items/show/1960 [accessed November 22, 2023]
|
| [17] |
Safadi C., 2014, Bronze age and Iron age Levantine harbour: an evaluation of their maritime accessibility and protection, [Thesis], [Southampton University
|
| [18] |
Milenkovic M., Kekic D, 2017, Using GIS in emergency management, SINTEZA ed., International scientific conference on ICT and E-Business related research, 2016.
|
| [19] |
Marghani M., Hashim M., 2011, A numerical method for retrieving sea surface salinity from MODIS satellite data, International Journal of the Physical Sciences Vol. 6(13), pp. 3116-3125, 4 July, 2011, Available online at
https://academicjournals.org/journal/IJPS/article-abstract/0DD8F1021560
|
| [20] |
Marine Copernicus, URL
https://marine.copernicus.eu/access-data/ocean-monitoring-indicators/global-ocean-acidification-mean-sea-water-ph-time-series
|
| [21] |
Muhsi M., Sukojo B. M., Taufik, M., Aji, P., & Jaelani, L. M. (2022) Estimation of Sea Surface Salinity Concentration from Landsat 8 OLI Data in the Strait of Madura, Indonesia. Forum Geografi. Vol. 36, No. 2.
|
| [22] |
NOAA, 2018, Scott M., Lindsey R., 2018, Unprecedented 3 years of global coral bleaching, 2014–2017, Edt. blunden J., Hartfield G., Eakin M., De La Cour J., accessed 22 March 2024, URL
https://www.climate.gov/news-features/understanding-climate/unprecedented-3-years-global-coral-bleaching-2014%E2%80%932017
|
| [23] |
Nader, Manal. 2015. Presentation: Coastal zone management in Lebanon., URL
https://www.pseau.org/outils/ouvrages/uob_coastal_zone_management_in_lebanon_2015.pdf
accessed April 6, 2024.
|
| [24] |
USGS geological survey, Landsat mission, Landsat 7, accessed 14 Jan 2024, URL
https://www.usgs.gov/landsat-missions/landsat-7
|
| [25] |
Young Jun Kim, Daehyeon Han, Eunna Jang, Jungho Im & Taejun Sung (2023) Remote sensing of sea surface salinity: challenges and research directions, GIS science & Remote Sensing, 60: 1, 2166377,
https://doi.org/10.1080/15481603.2023.2166377
|
| [26] |
Yang I., Acharya T., 2015, Exploring Landsat 8, Journal of International Journal of IT, Engineering and Applied Sciences Research (IJIEASR) ISSN: 2319-4413 Volume 4, No. 4, pp 4-10.
|
| [27] |
Yang J., et al., 2013, The role of satellite remote sensing in climate change studies, Journal of nature climate change vol 3, pp 875-883,
https://doi.org/10.1038/NCLIMATE1908
|
Cite This Article
-
ACS Style
Ghiye, S. S. E. Climate Change Impacts on Maritime Resources in Lebanon Using Satellites Imagery, Chekka Case Study. J. Water Resour. Ocean Sci. 2024, 13(3), 63-72. doi: 10.11648/j.wros.20241303.11
 Copy
|
Copy
|
 Download
-
@article{10.11648/j.wros.20241303.11,
  author = {Sirine Saad El-Dine Ghiye},
  title = {Climate Change Impacts on Maritime Resources in Lebanon Using Satellites Imagery, Chekka Case Study
},
  journal = {Journal of Water Resources and Ocean Science},
  volume = {13},
  number = {3},
  pages = {63-72},
  doi = {10.11648/j.wros.20241303.11},
  url = {https://doi.org/10.11648/j.wros.20241303.11},
  eprint = {https://article.sciencepublishinggroup.com/pdf/10.11648.j.wros.20241303.11},
  abstract = {This paper aims to explore the impact of climate change on underwater and coastal sites over the past few decades, with a specific focus on the Chekka area in North Lebanon. Given its rich maritime archaeology potential, this region has become a focal point, especially with the ongoing developments posing a threat to cultural resources. Detecting climate changes necessitates extensive measurements from various sources globally, including land stations, ships, and satellite imagery. In this study, we concentrate on changes in sea surface temperature (SST) over the last 20 to 40 years. The analysis heavily relies on satellite imagery, with a primary focus on Landsat 8, equipped with two bands of the thermal infrared sensor (TIRS), and Landsat 7, which carries the Enhanced Thematic Mapper Plus (ETM+) sensor, and also Landsat 5 TM. Utilizing QGIS for the calculation of SST, our findings reveal a noteworthy increase of 1° in sea surface temperature over the past two decades. This observation underscores the significance of ongoing climate change and its potential repercussions for the underwater and coastal cultural heritage in the Chekka area and its suburbs.
},
 year = {2024}
}
Copy
|
Download
-
TY  - JOUR
T1  - Climate Change Impacts on Maritime Resources in Lebanon Using Satellites Imagery, Chekka Case Study

AU  - Sirine Saad El-Dine Ghiye
Y1  - 2024/06/27
PY  - 2024
N1  - https://doi.org/10.11648/j.wros.20241303.11
DO  - 10.11648/j.wros.20241303.11
T2  - Journal of Water Resources and Ocean Science
JF  - Journal of Water Resources and Ocean Science
JO  - Journal of Water Resources and Ocean Science
SP  - 63
EP  - 72
PB  - Science Publishing Group
SN  - 2328-7993
UR  - https://doi.org/10.11648/j.wros.20241303.11
AB  - This paper aims to explore the impact of climate change on underwater and coastal sites over the past few decades, with a specific focus on the Chekka area in North Lebanon. Given its rich maritime archaeology potential, this region has become a focal point, especially with the ongoing developments posing a threat to cultural resources. Detecting climate changes necessitates extensive measurements from various sources globally, including land stations, ships, and satellite imagery. In this study, we concentrate on changes in sea surface temperature (SST) over the last 20 to 40 years. The analysis heavily relies on satellite imagery, with a primary focus on Landsat 8, equipped with two bands of the thermal infrared sensor (TIRS), and Landsat 7, which carries the Enhanced Thematic Mapper Plus (ETM+) sensor, and also Landsat 5 TM. Utilizing QGIS for the calculation of SST, our findings reveal a noteworthy increase of 1° in sea surface temperature over the past two decades. This observation underscores the significance of ongoing climate change and its potential repercussions for the underwater and coastal cultural heritage in the Chekka area and its suburbs.

VL  - 13
IS  - 3
ER  -
Copy
|
Download