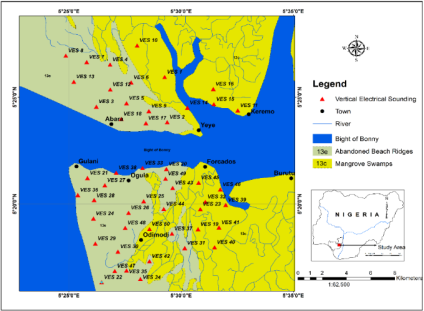
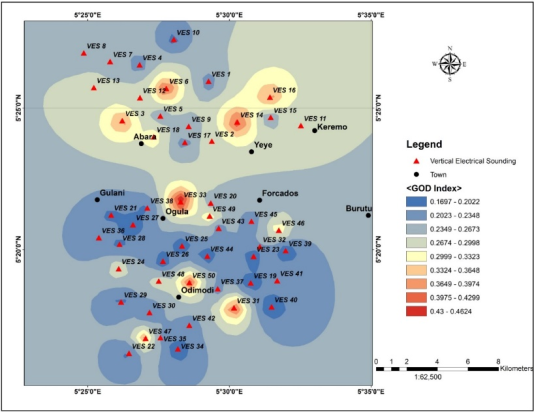
Groundwater is an important source for Nigerian water balance. Therefore assessing its experimental evidence supporting saltwater intrusion is necessary before initiating developmental plans using this resources. In this research, the extent of saltwater intrusion, physiochemical properties of groundwater samples and suitability was experimented in the study areas. Geophysical and geochemical techniques were employed in a research study to investigate saltwater intrusion in freshwater aquifers in coastal areas of Delta State, Nigeria. The resistivity data from fifty Vertical Electrical Soundings (VES) in the aquifer layers revealed high water content and saline intrusion, with resistivity ranging from 0.4 to 769.9 Ωm. The hydraulic resistance values ranged from 2.877m-1 to 27.2831m-1, determining the Aquifer Vulnerability Index (AVI). The findings from the Groundwater Occurrence and Depth (GOD) index classified the study area into low and moderate vulnerability classes, with values ranging from 0.168 to 0.420. Groundwater analysis indicated elevated levels of electrical conductivity, salinity, and total dissolved solids, exceeding WHO standards. Moreover, high concentrations of chloride, sodium, and potassium confirmed saltwater intrusion.
| Published in | Journal of Water Resources and Ocean Science (Volume 13, Issue 4) |
| DOI | 10.11648/j.wros.20241304.11 |
| Page(s) | 94-104 |
| Creative Commons |
This is an Open Access article, distributed under the terms of the Creative Commons Attribution 4.0 International License (http://creativecommons.org/licenses/by/4.0/), which permits unrestricted use, distribution and reproduction in any medium or format, provided the original work is properly cited. |
| Copyright |
Copyright © The Author(s), 2024. Published by Science Publishing Group |
Saltwater Intrusion, Freshwater, Aquifer, Groundwater Analysis and Resistivity
Vulnerability class | Index rating |
|---|---|
Negligible | 0.0 – 0.1 |
Low | 0.1 – 0.3 |
Moderate | 0.3 – 0.5 |
High | 0.5 – 0.7 |
Extreme | 0.7 – 1.0 |
Aquifer type | Note | Lithology (Ω-m) | Note | Depth to aquifer (m) | Note |
|---|---|---|---|---|---|
Non-aquifer | 0 | <60 | 0.4 | <2 | 1 |
Artesian | 0.1 | 60 - 100 | 0.5 | 2 – 5 | 0.9 |
Confined | 0.2 | 100 - 300 | 0.7 | 5 – 10 | 0.8 |
Semi-confined | 0.3 – 0.5 | 300 - 600 | 0.8 | 10 – 20 | 0.7 |
Unconfined | 0.6 – 1.0 | ˃600 | 0.6 | 20 – 50 | 0.6 |
VES No. | Location Name | Longitude (OE) | Latitude (ON) | Elevation (m) | Layer Resistivity | Layer thickness (m) | Layer depth (m) | Curves types | |||||||
|---|---|---|---|---|---|---|---|---|---|---|---|---|---|---|---|
|
|
|
|
|
|
|
|
|
| ||||||
1 | 5.3551 | 5.5080 | -1 | 13.0 | 3.3 | 5.2 | - | 3.7 | 18.7 | - | 3.7 | 22.4 | H | ||
2 | 5.3558 | 5.5108 | -4 | 632.3 | 72.2 | 150.3 | 20.4 | 1.0 | 8.0 | 13.2 | 1.0 | 9.0 | 22.2 | AK | |
3 | 5.3564 | 5.5122 | 3 | 133.0 | 11.0 | 96.3 | - | 3.2 | 7.2 | 3.2 | 5.4 | H | |||
4 | 5.3586 | 5.5177 | 3 | 0.5 | 7.3 | 1.4 | - | 2.5 | 12.9 | 2.5 | 15.5 | K | |||
5 | 5.3574 | 5.5164 | 2 | 5.2 | 16.6 | 6.4 | - | 0.6 | 37.7 | 0.6 | 38.3 | K | |||
6 | 5.3567 | 5.5127 | 2 | 114.6 | 39.8 | 8.4 | - | 1.3 | 8.9 | 1.3 | 10.2 | Q | |||
7 | 5.3567 | 5.5143 | 2 | 19.0 | 361.7 | 66.7 | - | 0.5 | 4.3 | 0.5 | 4.3 | K | |||
8 | 5.3522 | 5.5107 | 13 | 4.6 | 1.3 | 14.9 | - | 1.2 | 10.8 | 1.2 | 12.0 | H | |||
9 | 5.3535 | 5.5118 | 8 | 8.3 | 2.2 | 10.3 | - | 0.6 | 14.9 | 0.6 | 15.4 | H | |||
10 | 5.3549 | 5.5121 | 10 | 13.9 | 23.5 | 57.7 | - | 8.0 | 9.7 | 8.0 | 17.7 | A | |||
11 | 5.3535 | 5.5060 | 1 | 1264.5 | 417.9 | 58.4 | 1010.6 | 2.8 | 1.2 | 5.9 | 2.8 | 4.0 | 9.9 | QH | |
12 | 5.3534 | 5.5060 | 1 | 73.4 | 20.0 | 24.1 | - | 3.1 | 23.5 | 3.1 | 26.6 | H | |||
13 | 5.3513 | 5.5022 | 10 | 79.7 | 50.0 | 517.4 | - | 1.7 | 10.3 | 1.7 | 12.0 | H | |||
14 | 5.3503 | 5.5060 | 9 | 257.3 | 27.7 | 2.3 | - | 1.2 | 7.9 | 1.2 | 9.1 | Q | |||
15 | 5.3506 | 5.5043 | 9 | 16.7 | 4.8 | 16.1 | - | 1.4 | 9.3 | 1.4 | 10.7 | H | |||
16 | 5.3466 | 5.5019 | 8 | 122.2 | 22.1 | 5.0 | - | 3.6 | 8.4 | 3.6 | 12.0 | Q | |||
17 | 5.3510 | 5.5050 | 7 | 26.2 | 3.2 | 16.5 | - | 2.2 | 18.0 | 2.2 | 20.3 | H | |||
18 | 5.3517 | 5.5065 | 4 | 743.4 | 7.2 | 42.4 | - | 2.1 | 11.8 | 2.1 | 13.8 | H | |||
19 | 5.3564 | 5.3214 | 5 | 0.5 | 0.8 | 3.1 | 21.8 | 2.7 | 9.1 | 15.5 | 2.7 | 11.8 | 27.4 | AA | |
20 | 5.3564 | 5.3214 | 5 | 0.5 | 1.2 | 2.7 | - | 1.3 | 16.1 | 1.3 | 17.5 | A | |||
21 | 5.3564 | 5.3215 | 8 | 0.6 | 0.6 | 2.1 | 7.0 | 1.8 | 4.5 | 23.9 | 1.8 | 6.3 | 30.2 | AA | |
22 | 5.3577 | 5.2215 | 11 | 0.3 | 2.1 | 1.9 | - | 4.4 | 18.3 | 4.4 | 22.6 | K | |||
23 | 5.3584 | 5.3219 | 15 | 31.5 | 13.3 | 133.1 | 618.0 | 2.9 | 8.0 | 11.2 | 2.9 | 10.8 | 22.0 | HA | |
24 | 5.3641 | 5.3214 | 5 | 69.5 | 10.0 | 477.3 | - | 1.6 | 4.8 | 1.6 | 6.4 | H | |||
25 | 5.3642 | 5.3212 | -1 | 1.1 | 2.0 | 1.4 | 6.8 | 1.9 | 11.0 | 20.0 | 1.9 | 12.9 | 30.9 | KH | |
26 | 5.3643 | 5.3211 | 0 | 0.4 | 0.8 | 4.0 | 4.4 | 1.2 | 9.6 | 21.3 | 1.2 | 10.8 | 32.1 | AA | |
27 | 5.3654 | 5.3221 | 0 | 0.6 | 0.5 | 4.7 | 4.4 | 2.6 | 8.1 | 28.8 | 2.6 | 10.7 | 39.5 | HK | |
28 | 5.3652 | 5.3222 | 10 | 0.5 | 3.0 | 20.3 | - | 5.0 | 5.8 | 5.0 | 10.8 | A | |||
29 | 5.3652 | 5.3215 | 5 | 0.4 | 2.7 | 13.1 | - | 4.8 | 6.8 | 4.8 | 11.6 | A | |||
30 | 5.3656 | 5.3230 | 4 | 0.7 | 0.4 | 5.6 | - | 4.5 | 8.2 | 4.5 | 12.6 | H | |||
31 | 5.3620 | 5.3219 | 6 | 161.1 | 10.1 | 149.7 | - | 1.6 | 9.0 | 1.6 | 10.6 | H | |||
32 | 5.3615 | 5.3294 | 13 | 45.8 | 439.2 | 781.6 | - | 1.4 | 7.9 | 1.4 | 9.2 | A | |||
33 | 5.3598 | 5.3317 | 9 | 494.6 | 49.7 | 116.8 | - | 1.1 | 24.3 | 1.1 | 25.4 | H | |||
34 | 5.3478 | 5.3230 | -3 | 0.4 | 1.2 | 2.2 | 0.8 | 1.4 | 9.4 | 29.4 | 1.4 | 10.8 | 40.2 | AK | |
35 | 5.3479 | 5.3231 | 6 | 2.4 | 5.7 | 8.9 | - | 3.8 | 13.5 | 3.8 | 17.3 | A | |||
36 | 5.3486 | 5.3231 | -1 | 1.4 | 68.7 | 46.5 | - | 3.9 | 16.4 | 3.9 | 20.3 | K | |||
37 | 5.3492 | 5.3227 | -1 | 0.4 | 14.8 | 7.5 | - | 2.6 | 20.8 | 2.6 | 23.4 | K | |||
38 | 5.3542 | 5.3212 | 4 | 0.1 | 0.5 | 18.6 | 6.0 | 1.5 | 5.6 | 43.6 | 1.5 | 7.1 | 50.7 | AK | |
39 | 3.3556 | 5.3214 | 5 | 0.5 | 1.7 | 1.2 | 20.3 | 1.6 | 9.2 | 14.2 | 1.6 | 10.8 | 25.0 | KH | |
40 | 5.3556 | 5.3210 | 5 | 0.4 | 2.2 | 1.5 | 5.1 | 3.0 | 8.9 | 25.7 | 3.0 | 11.8 | 37.5 | KH | |
41 | 5.3556 | 5.3210 | 8 | 0.3 | 6.5 | 40.3 | - | 3.7 | 4.2 | 3.7 | 7.9 | A | |||
42 | 5.3560 | 5.3220 | 9 | 0.7 | 2.1 | 3.5 | - | 2.3 | 18.2 | 2.3 | 20.6 | A | |||
43 | 5.3560 | 5.3221 | 7 | 1.2 | 1.0 | 27.9 | - | 3.5 | 5.2 | 3.5 | 8.8 | H | |||
44 | 5.3565 | 5.3226 | 11 | 2.4 | 3.3 | 29.6 | 310.9 | 1.6 | 9.6 | 8.4 | 1.6 | 11.2 | 19.7 | AA | |
45 | 5.3601 | 5.3458 | 1 | 21.4 | 7.0 | 407.1 | - | 2.0 | 5.7 | 2.0 | 7.7 | H | |||
46 | 5.3512 | 5.3447 | -3 | 239.9 | 156.2 | 178.8 | - | 5.9 | 15.1 | 5.9 | 20.9 | H | |||
47 | 5.3505 | 5.3438 | 5 | 257.7 | 364.5 | 339.2 | - | 3.4 | 16.8 | 3.4 | 20.1 | K | |||
48 | 5.3505 | 5.3430 | -7 | 90.1 | 59.9 | 769.9 | 412.8 | 3.0 | 7.4 | 33.4 | 3.0 | 10.4 | 43.9 | HK | |
49 | 5.3516 | 5.3415 | -1 | 123.2 | 42.5 | 9.7 | 7.4 | 2.6 | 7.3 | 28.3 | 2.6 | 9.9 | 38.2 | ||
50 | 5.3551 | 5.3382 | 7 | 142.0 | 19.9 | 171.7 | - | 1.5 | 14.9 | 1.5 | 16.4 | H | |||
Sample | Concentrations () | WQI | ||||||||
|---|---|---|---|---|---|---|---|---|---|---|
|
|
|
|
|
|
|
|
| 440.85 | |
Ogulagha well | 26.00 | 210.00 | 74.00 | 849.00 | 241.00 | 14.00 | 314.00 | 0.98 | 0.73 | 460.17 |
Youbebe sea I | 29.00 | 198.00 | 68.00 | 789.00 | 239.00 | 13.00 | 321.00 | 1.03 | 0.82 | 617.77 |
Youbebe sea II | 40.30 | 214.00 | 81.00 | 910.00 | 256.00 | 11.37 | 298.00 | 1.43 | 0.91 | 486.99 |
Burutu well | 28.10 | 194.00 | 91.00 | 841.00 | 291.00 | 14.63 | 428.00 | 1.08 | 0.76 | 440.85 |
S/N | WQI Values | Water Quality Status |
|---|---|---|
1 | < 50 | Excellent |
2 | 50 – 100 | Good |
3 | 100 – 200 | Poor |
4 | 200 – 300 | Very poor |
5 | >300 | Unsuitable for drinking |
S/N | Parameters | Minimum ( | Maximum ( | Average ( |
|---|---|---|---|---|
1 | pH | 7.7 | 8.0 | 7.85 |
2 | Electrical conductivity ( | 19600.00 | 27000.00 | 22935.00 |
3 | Salinity ( | 24.00 | 31.00 | 28.00 |
4 | TDS ( | 810.00 | 1100.00 | 925.00 |
5 | DO ( | 2.40 | 3.80 | 2.98 |
6 | BOD ( | 3.03 | 6.67 | 4.39 |
7 | COD ( | 2.00 | 3.07 | 2.39 |
8 | ( | 26.00 | 40.30 | 30.85 |
9 | ( | 194.00 | 214.00 | 204.00 |
10 | ( | 68.00 | 91.00 | 78.50 |
11 | ( | 789.00 | 910.00 | 847.25 |
12 | ( | 239.00 | 291.00 | 256.75 |
13 | ( | 11.37 | 14.63 | 13.25 |
14 | ( | 298.00 | 428.00 | 340.25 |
15 | ( | 0.98 | 1.43 | 1.13 |
16 | ( | 0.73 | 0.91 | 0.81 |
VES points | Longitude (OE) | Latitude (ON) | G | O | D | G | O | D | GOD Index | Vulnerability class |
|---|---|---|---|---|---|---|---|---|---|---|
1 | 5.4551 | 5.5080 | Unconfined | 13 | 3.7 | 0.6 | 0.4 | 0.9 | 0.216 | Low |
2 | 5.3558 | 5.5108 | Unconfined | 704.5 | 9.0 | 0.6 | 0.6 | 0.8 | 0.288 | Low |
3 | 5.3564 | 5.5122 | Unconfined | 133 | 3.2 | 0.6 | 0.7 | 0.9 | 0.378 | Low |
4 | 5.3586 | 5.5177 | Unconfined | 0.5 | 2.5 | 0.6 | 0.4 | 0.9 | 0.216 | Low |
5 | 5.3574 | 5.5164 | Unconfined | 5.2 | 0.6 | 0.6 | 0.4 | 1.0 | 0.240 | Low |
6 | 5.3567 | 5.5127 | Unconfined | 114.6 | 1.3 | 0.6 | 0.7 | 1.0 | 0.420 | Moderate |
7 | 5.3567 | 5.5143 | Unconfined | 19 | 0.5 | 0.6 | 0.4 | 1.0 | 0.240 | Low |
8 | 5.3522 | 5.5107 | Unconfined | 4.6 | 1.2 | 0.6 | 0.4 | 1.0 | 0.240 | Low |
9 | 5.3535 | 5.5118 | Unconfined | 8.3 | 0.6 | 0.6 | 0.4 | 1.0 | 0.240 | Low |
10 | 5.3549 | 5.5121 | Unconfined | 13.9 | 8 | 0.6 | 0.4 | 0.8 | 0.192 | Low |
11 | 5.3535 | 5.5060 | Unconfined | 1682.4 | 4.0 | 0.6 | 0.6 | 0.8 | 0.288 | Low |
12 | 5.3534 | 5.5060 | Unconfined | 73.4 | 3.1 | 0.6 | 0.5 | 0.9 | 0.270 | Low |
13 | 5.3513 | 5.5022 | Unconfined | 79.7 | 1.7 | 0.6 | 0.5 | 1.0 | 0.300 | Low |
14 | 5.3503 | 5.5060 | Unconfined | 257.3 | 1.2 | 0.6 | 0.7 | 1.0 | 0.420 | Moderate |
15 | 5.3506 | 5.5043 | Unconfined | 16.7 | 1.4 | 0.6 | 0.4 | 1.0 | 0.240 | Low |
16 | 5.3466 | 5.5019 | Unconfined | 122.2 | 3.6 | 0.6 | 0.7 | 0.9 | 0.378 | Moderate |
17 | 5.3510 | 5.5050 | Unconfined | 26.2 | 2.2 | 0.6 | 0.4 | 0.9 | 0.216 | Low |
18 | 5.3517 | 5.5065 | Unconfined | 743.4 | 2.1 | 0.6 | 0.6 | 0.9 | 0.324 | Moderate |
19 | 5.3564 | 5.3214 | Unconfined | 1.3 | 11.8 | 0.6 | 0.4 | 0.7 | 0.168 | Low |
20 | 5.3564 | 5.3214 | Unconfined | 0.5 | 1.3 | 0.6 | 0.4 | 1.0 | 0.240 | Low |
21 | 5.3564 | 5.3215 | Unconfined | 1.2 | 6.3 | 0.6 | 0.4 | 0.8 | 0.192 | Low |
22 | 5.3577 | 5.2215 | Unconfined | 0.3 | 4.4 | 0.6 | 0.4 | 0.8 | 0.192 | Low |
23 | 5.3584 | 5.3219 | Unconfined | 44.8 | 10.8 | 0.6 | 0.4 | 0.7 | 0.168 | Low |
24 | 5.3641 | 5.3214 | Unconfined | 69.5 | 1.6 | 0.6 | 0.5 | 1.0 | 0.300 | Moderate |
25 | 5.3642 | 5.3212 | Unconfined | 3.1 | 12.9 | 0.6 | 0.4 | 0.7 | 0.168 | Low |
26 | 5.3643 | 5.3211 | Unconfined | 1.2 | 10.8 | 0.6 | 0.4 | 0.7 | 0.168 | Low |
27 | 5.3654 | 5.3221 | Unconfined | 1.1 | 10.7 | 0.6 | 0.4 | 0.7 | 0.168 | Low |
28 | 5.3652 | 5.3222 | Unconfined | 0.5 | 5.0 | 0.6 | 0.4 | 0.8 | 0.192 | Low |
29 | 5.3652 | 5.3215 | Unconfined | 0.4 | 4.8 | 0.6 | 0.4 | 0.8 | 0.192 | Low |
30 | 5.3656 | 5.3230 | Unconfined | 0.7 | 4.5 | 0.6 | 0.4 | 0.8 | 0.192 | Low |
31 | 5.3620 | 5.3219 | Unconfined | 161.1 | 1.6 | 0.6 | 0.7 | 1.0 | 0.420 | Moderate |
32 | 5.3615 | 5.3294 | Unconfined | 45.8 | 1.4 | 0.6 | 0.4 | 1.0 | 0.240 | Low |
33 | 5.3598 | 5.3317 | Unconfined | 494.6 | 1.1 | 0.6 | 0.8 | 1.0 | 0.480 | Moderate |
34 | 5.3478 | 5.3230 | Unconfined | 1.6 | 10.8 | 0.6 | 0.4 | 0.7 | 0.168 | Low |
35 | 5.3479 | 5.3231 | Unconfined | 2.4 | 3.8 | 0.6 | 0.4 | 0.9 | 0.216 | Low |
36 | 5.3486 | 5.3231 | Unconfined | 1.4 | 3.9 | 0.6 | 0.4 | 0.9 | 0.216 | Low |
37 | 5.3492 | 5.3227 | Unconfined | 0.4 | 2.6 | 0.6 | 0.4 | 0.9 | 0.216 | Low |
38 | 5.3542 | 5.3212 | Unconfined | 0.6 | 7.1 | 0.6 | 0.4 | 0.8 | 0.192 | Low |
39 | 3.3556 | 5.3214 | Unconfined | 2.2 | 10.8 | 0.6 | 0.4 | 0.7 | 0.168 | Low |
40 | 5.3556 | 5.3210 | Unconfined | 2.6 | 11.8 | 0.6 | 0.4 | 0.7 | 0.168 | Low |
41 | 5.3556 | 5.3210 | Unconfined | 0.3 | 3.7 | 0.6 | 0.4 | 0.9 | 0.216 | Low |
42 | 5.3560 | 5.3220 | Unconfined | 0.7 | 2.3 | 0.6 | 0.4 | 0.9 | 0.216 | Low |
43 | 5.3560 | 5.3221 | Unconfined | 1.2 | 3.5 | 0.6 | 0.4 | 0.9 | 0.216 | Low |
44 | 5.3565 | 5.3226 | Unconfined | 5.7 | 11.2 | 0.6 | 0.4 | 0.7 | 0.168 | Low |
45 | 5.3601 | 5.3458 | Unconfined | 21.4 | 2.0 | 0.6 | 0.4 | 0.9 | 0.216 | Low |
46 | 5.3512 | 5.3447 | Unconfined | 239.9 | 5.9 | 0.6 | 0.7 | 0.8 | 0.336 | Moderate |
47 | 5.3505 | 5.3438 | Unconfined | 257.7 | 3.4 | 0.6 | 0.7 | 0.9 | 0.378 | Moderate |
48 | 5.3505 | 5.3430 | Unconfined | 150 | 10.4 | 0.6 | 0.7 | 0.7 | 0.294 | Low |
49 | 5.3516 | 5.3415 | Unconfined | 165.7 | 9.9 | 0.6 | 0.7 | 0.8 | 0.336 | Moderate |
50 | 5.3551 | 5.3382 | Unconfined | 142 | 1.5 | 0.6 | 0.7 | 1.0 | 0.420 | Moderate |
GOD | Groundwater Occurrence and Depth |
WQI | Water Quality Index |
VES | Vertical Electrical Sounding |
| [1] | Omajene Aghogho, (2023). Investigation of Hydro geological Properties using Resistivity Data in parts of Delta State, Nigeria. Nigerian institute of Physics Journal vol. 23(1) 109-121. |
| [2] | George, N. J. (2021) Geo-electrically and hydrogeologically derived vulnerability assessments of aquifer resources in the hinterland of parts of Akwa Ibom State, Nigeria, Solid Earth Sciences, |
| [3] | Ibuot, J. C., Aka, M. U., Inyang, N. J. and Agbasi, O. E. (2022). Georesistivity and physicochemical evaluation of hydrogeologic units in parts of Akwa Ibom State, Nigeria. International Journal of Energy and water Resources, 6: |
| [4] | Omeje, E. T., Obiora, D. N., Okeke, F. N. Ibuot, J. C. and Omeje, V. D. (2023). Application of geoelectric technique and sensitivity analysis in assessment of aquifer vulnerability: a case study of Nsukka and Igbo‑Etiti Area, Eastern Nigeria. Environment, Development and Sustainability. |
| [5] | Egbai J. C. and Efeya P. (2013). Geoelectric Method for Investigating Saltwater Intrusion into Freshwater Aquifer in Deghele Community of Warri South Local Government Area of Delta State. Technical Journal of Engineering and Applied Science, 3(10), 819-827. |
| [6] | Okolie, E. C and Ogheneovo, A. (2012). Investigation of subsurface lithology and prolific aquifer using VES in Edjekota, Delta State Nigeria. International Journal of Research and Reviews in Applied Science 12(3) 468-476. |
| [7] | Brindha K, Neena Vaman KV, Srinivasan K et al., (2014). Identification of surface water-groundwater interaction by hydrogeochemical indicators and assessing its suitability for drinking and irrigational purposes in Chennai, Southern India. Appl water sci 4: 159-174. |
| [8] | Sajil Kumar PJ, Elango L, James EJ (2014). Assessment of hydrochemistry and groundwater quality in the coastal area of South Chennai, India, Arab J Geosci 7: 2641-2653. |
| [9] | Wu J, Li P, Qian H et al., (2014). Using correlation and multivariate statistical analysis to identify hydrogeochemical processes affecting the major ion chemistry of water: A case study in Laoheba phosphorite mine in Sichuan, China. Arab J Geosci 7: 3973-3982. |
| [10] | Wu J, Li P, Qian H (2015). Hydrochemical characterization of drinking groundwater with special reference to fluoride in an arid area of China and the control of aquifer leakage on its concentrations. Environ Earth sci 73: 8575-8588. |
| [11] | Bouzourra H, Bouhlila R, Elango L, et al., (2015). Characterization of mechanisms and processes of groundwater salinization in irrigated coastal area using statistics, GIS and hydrochemical investigations. Environ sci pollut Res 22: 2643-2660. |
| [12] | Vetrimurugan E, Elango L. (2015). Groundwater chemistry and quality in an intensively cultivated River Delta. Water Qual Expo Heal 7: 125-141. |
| [13] | Li P, Wu J, Qian H. (2016). Hydrochemical appraisal of groundwater quality for drinking and irrigation purposes and the major influencing factors: A case study in and around Hua, County, China. Arab J Ge osci 9: 1-17. |
| [14] | Oseji, J. O., 2010. Geophysical investigation of ground water Resources of Ogume Area of Ndokwa Land Delta State Nigeria. Journal of Science and Environment. Vol. 9 PP 1-2. |
| [15] | Egbai J. C 2012. Geoelectrical Evaluation of Ground water Potential in the Sedimentary Region of Abavo, Delta State and Urhonigbe, Edo State, Nigeria International Journal of Research and Reviews in Applied Sciences (IJRRAS) 10(3): 491-498. |
| [16] | Okolie, E. C (2013). Stratigraphic mapping of subsurface structures and groundwater potantials from electrical resistivitybsoundings in Onicha Olona, Atuma Iga and Akwukwu-Igbo Delta State, Nigeria. International Journal of Water Resources and Environmental Engineering 5(5) 280-288. |
| [17] | Ayolabi, E. A., Atakpo, E. A., Otobor E. C and Arerin., 2009. Ground water Quality Assessment using predrilling electrical measurement. Journal of Environmental Hydrology, Vol. 17, Paper 15, PP 10. |
| [18] | Sumsnarac, F. 2006. Mapping of sandy Aquifers by using high resolution reflection seismic and 2-D electrical tomography. Journal of Applied Geophysics, Vol. 58, PP. 144-157. |
| [19] | Ayolabi, E. A., 2005. Geoelectric evaluation of ground water potential: A case study of Alagba primary school, Akure, Southwest Nigeria. Journal Geological society of India, Vol. 66, PP. 491-495. |
| [20] | Ohwoghere-Asuma, O., Chinyem, I. F, & Essi, O. E (2017). Saltwater intrusion Appraisal of Shallow Aquifer in Burutu Area of Western Niger Delta with 2D Electrical Resistivity Tomography. Journal of Applied Science and Environmental Management, 21(2) 372-377. |
| [21] | Omajene A, Ighrakpata F, Umayah O. S (2023). Application of Geoelectric indices in Ground water vulnerability mapping: A case study of Agbor, Delta State, Southern Region Nigeria Discovery 2023; 59: e51d1210. |
| [22] | Ibuot, J. C., Okeke, F. N., Obiora, D. N. and George, N. J. (2019). Assessment of impact leachate on hydrogeological repositories in Uyo, Southern Nigeria. Journal of Environmental Engineering and Science 14(2), 97–107. |
| [23] | Obiora, DN, Ajala AE, Ibuot JC (2015). Evaluation of aquifer protective capacity of overburden units and soil corrosivity in Makurdi, Benue State, Nigeria, using electrical resistivity method. Journal of Earth System Science, 124(1), 125-135. |
| [24] | George N. J, Ibuot JC, and Obiora DN (2015) Geoelectrohydraulic parameters of shallow sandy aquifer in Itu, AkwaIbom State (Nigeria) using geoelectric and hydrogeological measurements. Journal of African Earth Sciences, 110: 52–63. |
| [25] | Nwajide, C. S. (2013). Geology of Nigeria's Sedimentary Basins. Springer. |
| [26] | Avbovbo, A. A. (1978). Tertiary lithostratigraphy of the Niger Delta. AAPG Bulletin, 62(2), 295-306. |
| [27] | Telford, W. M, Geldart, L. P., Sheriff, R. E 1990. Applied Geophysics 2nd Ed. Cambridge uni. Press, Cambridge. P. 770. |
| [28] | Lowrie W (1997) Fundamentals of geophysics. Cambridge University Press, New York. |
| [29] | Verma P, Singh PK, Sinha RR, Tiwari AK (2020): Assessment of groundwater quality status by using water quality index (WQI) and geographic information system (GIS) approaches: a case study of the Bokaro district, India. Applied Water Science, 10:27, 7 |
| [30] | Akakuru OC, Eze CU, Okeke OC, Opara AI, Usman AU. Iheme O, Ibeneme SI, Iwuoha PO (2022). Hydrogeochemical evolution, water quality indices, irrigation suitability and pollution index of groundwater (PIG) around eastern Niger Delta, Nigeria. International Journal of Energy and Water Resources, |
| [31] | WHO: Developing drinking-water quality regulations and standards (2020). |
| [32] | Foster, S. S. D., Hirata, R. C. A., (1987). Groundwater contamination. WHO/PAHO/HPE/ CEPI, Lima. |
| [33] | Khemiri S, Khnissi A, Alaya BA, Saidi S, Zargrouni F (2013) Using GIS for the comparison of intrinsic parameter methods assessment of groundwater vulnerability to pollution in scenarios of semiarid climate The case of foussana groundwater in the central of Tunisia. J. Water Resource Prot. 5(8): 835–845. |
| [34] | Akakuru O. C, Akudinobi B, Opara AI, Onyekuru SO, Akakuru OU (2021) Hydrogeochemicalfacies and pollution status of groundwater resources of Owerri and environs, Southeastern Nigeria. Environmental Monitoring Assess, 193, 623. |
APA Style
Aghogho, O., Chucks, E. J., Chukwuemeka, O. E. (2024). Investigation of Saltwater Intrusion into Freshwater Aquifers in Some Estuary Environment in Niger Delta. Journal of Water Resources and Ocean Science, 13(4), 94-104. https://doi.org/10.11648/j.wros.20241304.11
ACS Style
Aghogho, O.; Chucks, E. J.; Chukwuemeka, O. E. Investigation of Saltwater Intrusion into Freshwater Aquifers in Some Estuary Environment in Niger Delta. J. Water Resour. Ocean Sci. 2024, 13(4), 94-104. doi: 10.11648/j.wros.20241304.11
AMA Style
Aghogho O, Chucks EJ, Chukwuemeka OE. Investigation of Saltwater Intrusion into Freshwater Aquifers in Some Estuary Environment in Niger Delta. J Water Resour Ocean Sci. 2024;13(4):94-104. doi: 10.11648/j.wros.20241304.11
@article{10.11648/j.wros.20241304.11,
  author = {Omajene Aghogho and Egbai James Chucks and Okolie Emmanuel Chukwuemeka},
  title = {Investigation of Saltwater Intrusion into Freshwater Aquifers in Some Estuary Environment in Niger Delta
},
  journal = {Journal of Water Resources and Ocean Science},
  volume = {13},
  number = {4},
  pages = {94-104},
  doi = {10.11648/j.wros.20241304.11},
  url = {https://doi.org/10.11648/j.wros.20241304.11},
  eprint = {https://article.sciencepublishinggroup.com/pdf/10.11648.j.wros.20241304.11},
  abstract = {Groundwater is an important source for Nigerian water balance. Therefore assessing its experimental evidence supporting saltwater intrusion is necessary before initiating developmental plans using this resources. In this research, the extent of saltwater intrusion, physiochemical properties of groundwater samples and suitability was experimented in the study areas. Geophysical and geochemical techniques were employed in a research study to investigate saltwater intrusion in freshwater aquifers in coastal areas of Delta State, Nigeria. The resistivity data from fifty Vertical Electrical Soundings (VES) in the aquifer layers revealed high water content and saline intrusion, with resistivity ranging from 0.4 to 769.9 Ωm. The hydraulic resistance values ranged from 2.877m-1 to 27.2831m-1, determining the Aquifer Vulnerability Index (AVI). The findings from the Groundwater Occurrence and Depth (GOD) index classified the study area into low and moderate vulnerability classes, with values ranging from 0.168 to 0.420. Groundwater analysis indicated elevated levels of electrical conductivity, salinity, and total dissolved solids, exceeding WHO standards. Moreover, high concentrations of chloride, sodium, and potassium confirmed saltwater intrusion.
},
 year = {2024}
}
TY  - JOUR
T1  - Investigation of Saltwater Intrusion into Freshwater Aquifers in Some Estuary Environment in Niger Delta

AU  - Omajene Aghogho
AU  - Egbai James Chucks
AU  - Okolie Emmanuel Chukwuemeka
Y1  - 2024/10/31
PY  - 2024
N1  - https://doi.org/10.11648/j.wros.20241304.11
DO  - 10.11648/j.wros.20241304.11
T2  - Journal of Water Resources and Ocean Science
JF  - Journal of Water Resources and Ocean Science
JO  - Journal of Water Resources and Ocean Science
SP  - 94
EP  - 104
PB  - Science Publishing Group
SN  - 2328-7993
UR  - https://doi.org/10.11648/j.wros.20241304.11
AB  - Groundwater is an important source for Nigerian water balance. Therefore assessing its experimental evidence supporting saltwater intrusion is necessary before initiating developmental plans using this resources. In this research, the extent of saltwater intrusion, physiochemical properties of groundwater samples and suitability was experimented in the study areas. Geophysical and geochemical techniques were employed in a research study to investigate saltwater intrusion in freshwater aquifers in coastal areas of Delta State, Nigeria. The resistivity data from fifty Vertical Electrical Soundings (VES) in the aquifer layers revealed high water content and saline intrusion, with resistivity ranging from 0.4 to 769.9 Ωm. The hydraulic resistance values ranged from 2.877m-1 to 27.2831m-1, determining the Aquifer Vulnerability Index (AVI). The findings from the Groundwater Occurrence and Depth (GOD) index classified the study area into low and moderate vulnerability classes, with values ranging from 0.168 to 0.420. Groundwater analysis indicated elevated levels of electrical conductivity, salinity, and total dissolved solids, exceeding WHO standards. Moreover, high concentrations of chloride, sodium, and potassium confirmed saltwater intrusion.

VL  - 13
IS  - 4
ER  -
Department of Physics, Delta State University, Abraka, Nigeria
Department of Physics, Delta State University, Abraka, Nigeria