Research Article | | Peer-Reviewed

Assessment of the Vulnerability of the Kribi Coastal Zone (South Cameroon) to Ocean Acidification Based on Zooplankton and Carbonate Chemistry

Received: 21 July 2026     Accepted: 12 August 2026     Published: 15 September 2026
Views:       Downloads:
Abstract

Assessing the vulnerability of a coastal area to an anthropogenic factor is crucial for developing adaptation or mitigation strategies. As other countries, Cameroon is exposed to ocean acidification (OA), but very little is known about the extent of its vulnerability. This study aim was to assess the vulnerability of the coastal ocean ecosystem of Kribi (Southern Cameroon) to ocean acidification. Thus, simultaneous monitoring of carbonate system parameters, zooplankton communities, and others environmental variables was conducted in the area between September 2021 and August 2022. Three monitoring stations and a seasonal sampling strategy were established to understand organism’s exposition to changes in the carbonate chemistry and OA. Seawater physicochemical parameters were measured in situ using a calibrated water quality multimeter probe. Nutrients, chlorophyll-a, and total alkalinity (TA) were measured in the laboratory using appropriates methods, with water samples for TA analysis fixed using mercuric chloride (HgCl2). Based on the pH, TA, salinity, and temperature values, the others parameters of the carbonate system were calculated using the CO2SYS_Xls program. Zooplankton was collected at the surface with a 64-micron plankton net and fixed in 5% formaldehyde, then transported to the laboratory for counting and identification. The Coastal Ocean Acidification Vulnerability Index (COAVI) was then used to determine the area’s vulnerability level. As results, 45 zooplankton species, belonging to 7 phylum and 32 families were identified. Copepod was the dominant group in all sampling stations during all the seasons. Environmental conditions were characterized by high temperature (28.56 ± 1.85°C) and a salinity that varied according to the rainfall. The carbonate system indicates that the critical threshold of OA was not reached in the area, as seawater remained saturated with respect to aragonite and calcite saturation (Ω ˃ 1). Although, lowest value of pH, aragonite and calcite were observed during the small and large rainy seasons. Low pH and high pCO2 values were accompanied by a drop in diversity, while salinity variation drives selective presence of some taxa in the area. The COAVI index showed an overall value of 0.53, indicating moderate vulnerability to OA in the study area. Station Bp, with an index of 0.81 was the most vulnerable, while the rainy seasons, with an index of 0.76 are at the highest risk. The study highlighted the area’s vulnerability to OA, which calls for raising awareness and developing local environmental management strategies.

Published in Journal of Water Resources and Ocean Science (Volume 15, Issue 5)
DOI 10.11648/j.wros.20261505.11
Page(s) 177-197
Creative Commons

This is an Open Access article, distributed under the terms of the Creative Commons Attribution 4.0 International License (http://creativecommons.org/licenses/by/4.0/), which permits unrestricted use, distribution and reproduction in any medium or format, provided the original work is properly cited.

Copyright

Copyright © The Author(s), 2026. Published by Science Publishing Group

Keywords

Vulnerability, Ocean Acidification, Zooplankton, Carbonate System, Cameroon

1. Introduction
Coastal ocean ecosystems provide a wide range of benefits, including biodiversity, habitat support, and the livelihoods of coastal communities . They are highly productive ecosystems, supporting species development and fisheries systems. As human activities are mostly situated in coastal areas, coastal ocean ecosystems and their resident species are under increasing pressure from a multitude of climate-induced and non-climate drivers . Zooplankton, as an important component of the marine food web, transferring nutrients and energy from primary producer to higher trophic level , are often used as bioindicators of environmental changes and water quality . Zooplankton species diversity and abundance are mirror of the health status of aquatic ecosystems, as their communities can quickly respond to changes of environmental factors due to their short life cycles . Among the many pressures facing marine and coastal ecosystems, ocean and coastal acidification is a global threat with local specificities, mainly caused by the ocean absorption of atmospheric carbon dioxide (CO2), leads to change in seawater chemistry characteristics, lowering its pH . This phenomenon can have negative consequences for biodiversity and the functioning of these ecosystems. Zooplankton was identified among the group of organisms that can be affected by the ongoing ocean acidification (OA) . Laboratory studies showed that low pH and high pCO2 (partial pressure in carbon dioxide) associated to OA can affect significantly the survival, growth, calcification, development, and reproduction of planktonic organisms, by changing intracellular pH and enzyme activity . This can result in the modification of the community structure and rarefaction of pH sensitive species, influencing the productivity of higher trophic level, starting by small pelagic fish.
Over the past decade, Kribi and its surrounding areas have experienced significant economic development driven by the implementation of major infrastructure projects, including the construction of roads and highways, the construction and exploitation of power plant fueled by liquefied natural gas, and the construction and operation of the deep-water port of Kribi. These infrastructure projects have spurred industrialization in the area with the establishment of heavy industries such as cement plants, which have joined the existing oil exploration and production activities in the region, as well as an agro-industrial sector. Thus, global environmental issues, including climate change and ocean acidification, could be exacerbated by local human activities and have a negative impact on marine habitats, biodiversity, and the functioning of local marine ecosystems.
OA research in the Cameroon context remain at their early stage due to the existence of few infrastructure and little equipment to monitor the changing chemistry of seawater . To date, no vulnerability assessment of Cameroon’s marine ecosystems to ocean acidification has been carried out, despite the fact that OA could potentially have a negative impact on fisheries, with serious socio-economic consequences for coastal communities. The IPCC (Intergovernmental Panel on Climate Change) definition of vulnerability states that “vulnerability is the degree by which a system is susceptible to, and unable to cope with, adverse effects of climate change, including climate variability and extremes” , assessing vulnerability in coastal zone or communities is a function of their exposure, sensitivity and adaptive capacity . The comprehension of vulnerability constitutes the basis for the formulation of strategies and the implementation of actions that are aimed at mitigating the repercussions on human populations while concurrently endeavoring to optimize ecosystem goods and services . In order to assess the vulnerability of the coastal ocean ecosystem at Kribi (southern Cameroon) to ocean acidification, we conducted a simultaneous monitoring of carbonate system, zooplankton communities and other environmental variables in the area. The COAVI (Coastal Ocean Acidification Vulnerability Index) index, which provides an indication of the vulnerability of a given coastal ocean ecosystem to OA was applied using zooplankton as indicator. Thus, it is presented here (1) the community stand of zooplankton and their Spatio-temporal distribution, (2) the exposure to carbonate chemistry and environmental variables experienced by these organisms and (3) the assessment of ecosystem vulnerability base on the COAVI index.
2. Materials and Methods
2.1. Description of the Study Area
The study was conducted in a portion of the southern Atlantic coast of Cameroon at Kribi and its surroundings areas. The climate of the area is an equatorial type characterized by constant and high temperature with four seasons: two rainy seasons (September - November and April - June), and two dry seasons (December - March and July - August) . The tidal cycle of Cameroon coast is semidiurnal with constituents ranging between 0.5 m and 0.85 m .
Three fixed sampling stations each situated at about 3km from the shoreline (Figure 1) were selected based on anthropogenic activities in its proximity and the relative importance of the area for small pelagic fishing by local communities. The Bp sampling station (3°06’5.22’N, 9°55’50.66’’E), was situated around a marine gas pipeline, carrying natural gas from offshore to the gas facility plant located on the coast within 5km. It has been established that the process of liquefying natural gas results in emission of CO2 and Sulphur dioxide (SO2) that could contribute to acidify near surface seawater in the area . The Kb sampling station (2°57’4.82’’N, 9°52’40.08’’E), was located not far from the mouth of the Kienké river, which flows through the agro-industrial zone around Kribi and carries urban and household waste from the coast to the ocean. The Eb sampling station (2°48’25.20’’N, 9°51’44.96’’E) was located less than 10km from the Kribi Port and an oil exploitation platform. Local communities traditionally fish for small pelagic in the areas where the stations were located.
Figure 1. Study area and location of sampling stations.
2.2. Zooplankton Collection and Water Sampling
Samples were collected in each sampling station from September 2021 to August 2022 covering all the seasons encountered in the study area. Collection was made in the month of September and November during the large rainy season (LRS), December and March, covering the large dry season (LDS), April and June during the small rainy season (SRS), July and August during the small dry season (SDS). Zooplankton samples were collected at about 1m in the sub-surface water by filtering 100 L of seawater with a plankton net of 64 µm mesh size and 50 cm diameter. The filtrate obtained was then collected in a 500 ml double capped polyethylene bottle and fixed with 5% formaldehyde solution and transported to the laboratory for counting and identification .
Water samples dedicated to the analysis of Total Alkalinity (TA) were collected in each station at the sub-surface in the same frequency and the same time than plankton collection. Seawater for TA was collected in a 250 ml borosilicate reagent bottles and fixed with 50 µl of saturated mercuric chloride (HgCl2) to prevent any biological activity .
2.3. Field and Laboratory Measurement of Seawater Physicochemical Parameters
At each sampling station, temperature (°C), hydrogen potential (pH), salinity (PSU), dissolved oxygen (mg/l) and total dissolved solids (TDS, g/l) were measured in situ at the same time and frequency of the samples collection using a well calibrated water quality multimeter probe (Hanna Instrument, HI 9829). The probe is placed in the water at the sampling station and left there for about 3 minutes to allow the device to stabilize. The measurement is then initiated, and the various values are recorded. The procedure is repeated three times to improve the accuracy of measurement.
Calibration was carried out once for each sampling campaign, using the different buffer solution provided and the recommended methods of the manufacturer. The probe measure pH with an accuracy of ± 0.02, ± 0.01 PSU for salinity and temperature with an accuracy of ± 0.15°C. Each measurement was taken three times for data quality control. All the water sampling and in situ measurement were realized in the morning between 6:00 am and 12:00 pm.
In the laboratory nutrients were analyses spectrophotometrically using a HACH DR/3900 spectrophotometer. Nitrate was determined using the HACH method N°8171 with detection level between 0.1mg/L 𝑁𝑂3 and 10 mg/l 𝑁𝑂3. Nitrite concentration was measured using HACH method N° 8507, with detection level up to 0.30mg/l. Ammonia was evaluated using the ammonia salicylate method, HACH method N° 8155. Orthophosphate concentrations were determined using the HACH method N° 8048, using the ascorbic acid, with the detection level ranged between 0.02 mg/l 𝑃𝑂43−, and 2.50 mg/l 𝑃𝑂43−. Chlorophyll-a in the other hand was extracted using 90% acetone in darkness, after filtration of 200 ml of seawater sample. Then optical density was read on spectrophotometer at 630 nm, 645 nm and 663 nm wave length. Chlorophyll-a concentration was then calculated in mg/l following the equation (1) below.
Chl.a mg.l-1 =[11.64 ×O.D×663-2.16×O.D×645-0.1×O.D×630]×vV×l(1)
Where:
O.D = optical density; v = volume of acetone extract ml;
V= volume of filtered sample ml and l = optical length
Total alkalinity (TA) was measured by titration of 50 ml of seawater sample with 0.1 N hydrochloric acid (HCl), using methyl orange 0.1% w/v as dye solution . The volume of acid necessary to induce change of the solution color was recorded and used to calculate the corresponding TA. The analysis was repeated twice for each sample to reduce manipulation error. The carbonate system calculations were made based on Total alkalinity, in situ pH, temperature and salinity using CO2SYS_Xls program . Carbonate system constants was calculated according to for K1 and K2 dissociation constants, for bisulfate (KHSO4) dissociation constants and for borate concentration. Laboratory temperature was considered constant at 25°C for computations. Thus, pCO2, carbonate ions concentration, aragonite and calcite saturation state (Ω) were derived from calculation for the study period.
2.4. Laboratory Analysis of Zooplankton Samples
Once in the laboratory, each zooplankton sample collected was concentrated into a 10 ml sub-sample. This sub-sample was then observed under a ZEISS optical microscope until it was completely exhausted. Identification of zooplankton organisms was carried out using specific identification keys . The process of identification was conducted at the lowest possible taxonomic level. The number of individuals observed in each subsample was then recorded.
2.5. Vulnerability of the Kribi Coastal Ocean Ecosystem to Acidification Framework
The application of the Coastal Ocean Acidification Vulnerability Index (COAVI) to the study area in Kribi has been adapted from the method described by . This index summarizes exposure to acidification, the sensitivity of local organisms (zooplankton) and ecosystems, and adaptation ability. The method applies a weighted sum technique to the individual components of the COAVI formula. The overall formula is as follows:
COAVI= Ei+ Si- Ai(2)
Where, Ei is the exposure component, Si the sensitivity and Ai the adaptive capacity.
The COAVI index generally ranges from 0 (very low vulnerability) to 1 (very high vulnerability). The Table 1 presents the classification of vulnerability levels.
Table 1. Classification of vulnerability levels.

Ranges

Level of vulnerability

0.00 - 0.20

Very low vulnerability

0.21 - 0.40

Low vulnerability

0.41 - 0.60

Moderate vulnerability

0.61 - 0.80

High vulnerability

0.81 - 1.00

Very high vulnerability

To determine the Exposure factor (Ei), we used six normalized sub-indicators (TA, pH, pCO2, Ar, temperature and salinity), which reflect the degree of exposure to acidification. Each parameter has been standardized to have a value between 0 and 1 during the study period or at the sampling station in question. The calculation formula is as follows:
Ei=pCO2nor+TAnor+pHnor+Arg.nor+Temp.nor+Sal.nor6(3)
Where:
1) pCO2nor is the normalized value of carbon dioxide partial pressure
2) TAnor the normalized value of total alkalinity
3) pHnor the normalized value of pH
4) Arg.nor the normalized value of aragonite
5) Temp.nor the normalized value of temperature
6) Sal.nor the normalized value of salinity
For each variable, normalization was performed using the formula described by .
The sensitivity indicator (Si) was determined based on two sub-indicators: the proportion of calcifying organisms and the Shannon diversity index (H’).
Si= proportion of calcifying organisms + Hmoy'Hmax.T'2(4)
With: H′moy: the value of the Shannon index
H′max.T: the theoretical value of Shannon index fixed to 3.
To analyze the adaptive capacities in the area, we used information produced by in the analysis of adaptation capacity to climate change in the area. The author concluded that adaptive capacity is relatively low in the area. We used factor for assessing resilience RE, environmental management capacity factor GE, water quality QE and anthropogenic pressure PA Water quality assessment of the area was based on We used the following formula for calculation:
Ai=GE+RE+QE+PE4(5)
2.6. Data Analysis
Analysis of biological data was based on abundances, and the calculation of different index.
As biological index, the Shannon - Weaver diversity index (H') is designated to express the diversity of a given ecosystem by taking into account both the number of species present and the abundance of individuals within each species. It was calculated in accordance with the following formula:
H'=-niNlog2niN(6),
Where: ni=number of individuals of the specie I and N=total number of individuals.
The Pielou evenness index (J) was calculated to measure the equitability of the distribution of individuals within the species. It was calculated following the formula:
J= H'log2 S(7),
Where: H'=Shannon-Weaver diversity index, and S=total number of species or species richness.
The Margalef index (D) quantify the diversity by relating specific richness to the total number of individuals . It was calculated based on the following formula:
D=(S-1)/log2N(8),
Where: D=Margalef index, S=species richness and N=total number of individuals.
For environmental variables, the Shapiro - Wilk normality test was applied to verify their normal distribution. For variables that satisfy the normality assumption, the ANOVA test was applied to compare the variance and understanding whether their variation was significant or not between sampling stations as well as between seasons. If the difference appeared significant, a Tukey HSD (honestly significant difference) post hoc test was applied. The environmental variables which did not satisfy the normality assumption were analyzed using the Kruskal Wallis non-parametric test. If the difference appeared significant the Dunn’s pairwise test was applied with a Bonferroni correction for p-values. All statistical tests were performed at 5% significance level. To understand the relationship between the distribution of zooplankton abundance and environmental variables (temperature, salinity, pH and pCO2), scatter plots of distribution of abundance of all species in function of each parameter per season was used. Then Principal Component Analysis (PCA) were applied to the dataset to assess the majors controlling factors affecting zooplankton abundance in the study area at seasonal scale. All the data was analyzed using the R software program version 4.4.0 .
3. Results
3.1. Zooplankton Community Structure
During this study, a total of 45 zooplankton species, belonging to 7 phylum and 32 families, were identified. About 62.2% of the total species identified belonged to the copepod group. Four families (Calanidae, Paracalanidae, Centropages and Corycaeidae) presented the highest number of species (3 species each), followed by Temoridae, Pontellidae and Sagittidae families with 2 species each. The distribution of these species during all the seasons and at the three sampling sites is showed in Table 2. About 22 species were identified during the LRS, 34 species during the LDS, 34 during the SRS and 29 during the SDS. At the spatial scale, 34 species belonged to 25 families was identified at the Bp sampling station, 29 species from 22 families in Kb and 34 species from 25 families in Eb.
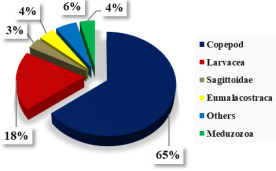
Quantitatively, 9208 individuals were observed during the study period. With the highest number of organisms harvested during the LDS (about 3005 Ind/L). Among all the groups harvested, copepods represented the dominant group (65% of total abundance) (Figure 2), followed by Larvacea (18%). A significant difference was founded in species abundances between LRS and SDS (adjusted p-value = 0.016) as showed by the Dunn test. However, no significant difference in abundance was found between sampling stations (p-value ˃ 0.05).
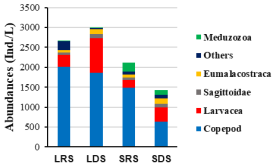
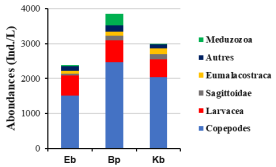
At each season, copepods were the most abundant group, with the highest abundance during the LRS (2007 Ind/L), followed by Larvacea that presented highest abundance during the LDS (859 Ind/L), as presented in Figure 3. Spatially, the same tendency was observed, with copepod being the most abundant group with the highest number collected at Bp and the lowest at Eb (Figure 4).
Table 2. Diversity and abundance of zooplankton community observed in a portion of the southern coast of Cameroon at Kribi during the study period.

Phylum/Sub-phylum

Sub-class

Order

Families

Genera

Species

Abr

LRS

LDS

SRS

SDS

Eb

Bp

Kb

Eb

Bp

Kb

Eb

Bp

Kb

Eb

Bp

Kb

Arthropoda/Crustacea

Eumalacostraca

Decapod

Mysidae

Mysis

Mysis sp

My

-

20

10

10

-

5

13

50

8

-

18

25

Luciferidae

Lucifer

Lucifer sp

Lu

-

5

5

5

-

10

-

-

-

28

10

28

Euphausiacea

Euphausiidae

Euphausia

Euphausiid larvae

Eup

10

-

5

10

13

65

-

-

-

18

10

Copepoda

Calanoida

Pontellidae

Labidocera

Labidocera sp

La.sp

-

69

350

35

320

33

-

123

5

25

15

-

Labidocera acuta

La.acu

-

-

-

-

-

18

-

-

-

-

-

-

Calanidae

Calanus

Calanus helgolandicus

Ca.hel

-

73

-

5

340

-

-

-

-

-

-

-

Calanus sp

Ca.sp

-

-

-

18

5

10

15

20

20

-

-

-

Canthocalanus

Canthocalanus sp

Cant

-

-

-

-

-

-

-

-

85

-

-

-

Paracalanidae

Paracalanus

Paracalanus sp

Pa.sp

-

130

150

-

35

-

-

35

-

33

75

-

Acrocalanus

Acrocalanus sp

Ac.sp

105

10

25

173

5

63

10

25

95

30

20

35

Acrocalanus andersoni

Ac.ad

-

-

93

5

5

-

12

-

-

-

-

-

Temoridae

Temora

Temora longicornis

Te.l

-

-

-

-

-

-

-

-

-

-

35

-

Temora turbinata

Te.t

-

23

105

20

60

-

10

20

-

5

30

10

Acartiidae

Acartiella

Acartiella sp

Ac

15

5

-

30

15

-

-

10

13

-

10

-

Lucicutiidae

Lucicutia

Lucicutia ovalis

Luci

-

-

-

-

40

-

-

-

20

-

15

-

Centropagidae

Centropages

Centropages sp

Ce.sp

20

-

-

30

10

-

-

10

58

18

-

-

Centropages hamatus

Ce.ha

-

-

-

20

-

-

-

-

40

-

-

-

Centropages furcatus

Ce.fu

-

-

-

20

-

-

-

-

-

17

-

-

Augaptilidae

Centraugaptilus

Centraugaptilus sp

Cent

-

-

-

-

-

-

-

135

-

-

-

-

Candaciidae

Candacia

Candacia sp

Cad

-

-

-

-

-

-

-

35

-

-

44

-

Clausocalanidae

Clausocalanus

Clausocalanus sp

Cl

-

-

241

-

-

-

-

-

130

-

-

-

Cyclopoida

Corycaeidae

Corycaeus

Corycaeus sp

Co.sp

305

115

53

73

58

45

33

45

50

15

-

-

Corycaeus dahli

Co.d

-

95

-

13

-

-

-

-

-

-

20

-

Corycaeus crassiusculus

Co.c

-

-

-

145

48

40

-

-

33

-

38

-

Oncaeidae

Oncaea

Oncaea sp

On

-

-

-

5

-

-

-

-

10

-

-

-

Sapphirinidae

Sapphirina

Sapphirina nigromaculata

Sa

-

-

-

10

-

-

-

-

-

-

-

-

Oithonidae

Oithona

Oithona brevicornis

Oi

-

-

-

10

-

-

48

-

-

-

-

-

Harpaticoida

Euterpinidae

Euterpina

Euterpina sp

Eu.sp

-

-

-

-

-

-

-

-

15

-

-

-

Euterpina acutifrons

Eu.ac

-

5

-

8

10

-

56

8

58

85

-

-

Ectinosomatidae

Microsetella

Microsetella norvegica

Mi

-

-

-

-

-

-

15

-

-

-

-

20

Copepod eggs

Cop.eg

-

-

-

-

-

-

-

165

-

-

-

-

Alpheidae

Nauplius

Copepod nauplii

Cop.na

-

-

20

5

40

43

10

5

13

-

14

33

Cirripedia

Cerripede nauplii

Cer

-

-

-

-

5

-

-

-

-

-

13

-

Myodocopa

Myodocopida

Cypridinidae

Cypridina

Cypridina sp

Cy

-

-

-

-

-

-

7

-

-

-

-

-

Arthropoda/Chelicerata

Acari

Trombidiformes

Halacaridae

mite

mi

-

-

5

-

-

-

-

-

10

5

5

-

Cnidaria/Anthozoa

Actiniaria

Halcampoididae

Halcampoides

Halcampoides sp

Ha

55

78

85

-

5

-

38

5

5

-

-

-

Cnidaria/Medusozoa

Hydroidolina

Siphonophorae

Diphyidae

Chelophyes

Chelophyes sp

Ch

-

5

-

5

8

-

-

205

8

-

117

-

Cnidaria/Medusozoa

Leptomedusae

Eirenidae

Eutima

Eutima sp

Eut

-

-

-

5

-

-

5

-

-

8

-

-

Heliozoa

Ciliophrydae

Actimonas

Actimonas sp

Act

-

-

-

-

-

-

-

15

-

-

5

-

Echinodermata/Asterozoa

Ophiurida

Ophiuridae

Ophiopluteus

Ophiopluteus larvae

Op.l

-

-

-

5

15

-

-

-

-

10

-

-

Chordata/Tunicata

Copelata

Oikopleuridae

Oikopleura

Oikopleura labradoriensis

Oi.l

160

130

10

306

220

228

10

10

176

86

220

24

Fritillariidae

Fritillaria

Fritillaria sp

Fr

-

-

-

20

10

75

-

-

-

-

33

-

Doliolida

Doliolidae

Dolioletta

Dolioletta sp

Dol

-

-

-

-

-

-

-

-

-

11

29

5

Ciliophora/Intramacronucleata

Choretrichia

Tintinnida

Tintinnidiidae

Leprotintinnus

Leprotintinnus sp

Lep

-

-

5

-

5

-

-

-

-

-

-

-

Chaetognatha

Aphragmophora

Sagittidae

Sagitta

Sagitta sp

Sag

-

8

60

17

50

35

-

15

23

20

42

30

Mesosagitta

Mesosagitta sp

Mes

-

-

-

5

-

-

-

13

-

-

-

-

Total Abundance (Ind./L)

2663

3005

2111

1429

Species richness (S)

22

34

34

29

Shannon Index (H’)

2.8 ± 0.62

3.27 ± 0.2

3.5 ± 0.17

3,41 ± 0,35

Pielou Index (J)

0,78 ± 0,04

0,75 ± 0,06

0,84 ± 0,04

0,88 ± 0,06

Margalef Index (D)

1,18 ± 0,47

2,03 ± 0,71

1,88 ± 0,27

1,64 ± 0,57

Figure 2. relative abundance of major zooplankton groups.
Figure 3. Seasonal variation of the abundance of major zooplankton groups identified.
Figure 4. Spatial variation of the abundance of major zooplankton groups identified.
In terms of species abundance, Oikopleura labradoriensis was the most abundant specie harvested during the LDS (754 Ind./L) and the SDS (330 Ind./L), followed by Calanus helgolandicus (345 Ind./L) and Chelophyes sp (117 Ind./L) respectively. During the LRS the most abundant specie harvested was Labidocera sp (419 Ind./L), followed by Corycaeus sp (473 Ind./L). During the SRS the most abundant specie collected was Chelophyes sp (213 Ind./L), followed by Oikopleura labradoriensis (196 Ind./L).
3.2. Spatial and Seasonal Variation of Shannon-Weaver Diversity Index (H′), Pielou Equitability (J) and Margalef Index (D)
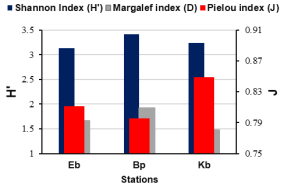
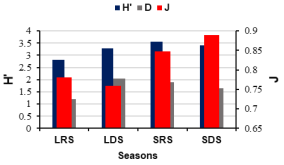
Shannon and Weaver index (H') globally show a moderate ecological status level. At the spatial level (Figure 5), the value of H'was 3.41±0.23 bits/Ind at the Bp sampling station, 3.23 ± 0.33 bits/Ind at the Kb, and 3.12 ± 0.69 bits/Ind at Eb. The Pielou (J) equitability index showed a value of 0.79 ± 0.05 at the Bp station, 0.84 ± 0.07 at Kb, and 0.81 ± 0.08 at Eb. Concerning the Margalef (D) index, the value of 1.91 ± 0.32 was obtained at Bp, 1.48 ± 0.47 at Kb, and 1.66 ± 0.84 at Eb. At the seasonal level (Figure 6), the Shannon and Weaver diversity index (H') presented a value of 2.8 ± 0.62 bits/Ind during the LRS, 3.27 ± 0.2 bits/Ind during the LDS, 3.5 ± 0.17 bits/Ind during the SRS, and 3,41 ± 0,35 bits/Ind during the SDS. Margalef index (D) presented a mean value of 1,18 ± 0,47 during the LRS, 2,03 ± 0,71 during the LDS, 1,88 ± 0,27 during the SRS, and 1,64 ± 0,57 during the SDS. The Pielou (J) index showed high values during all the sampling seasons with highest value (0,88 ± 0,06) obtained during the SDS, and the lowest (0,75 ± 0,06) during the LDS.
Figure 5. Spatial representation of diversity indexes.
Figure 6. Seasonal representation of diversity indexes.
3.3. Environmental Conditions and Carbonate System Variation in the Coastal Ocean of Southern Cameroon
The variation of the physicochemical conditions of seawater at each station during all the seasons is presented in Table 3. During all the study period, the sea surface water remains warm and exhibited a mean temperature of 28.56 ± 1.85°C. Temperature was not significantly different between sampling station (p-value ˃ 0.05), but was significantly different between the SDS-LDS, LRS-LDS, SDS-LRS and SRS-SDS according to the Tukey HSD test (adjusted p-value < 0.05), with a large effect of seasons on the variance of temperature (η2 = 0.79). The LDS presented the highest mean value (30.44 ± 0.66°C), and the SDS the lowest value (25.98 ± 0.76°C). However, for the other physicochemical parameters (salinity, D. O, TDS, nitrite, nitrate, phosphate, chlorophyll-a, and nitrogen ammonia), no significative difference was found between sampling stations, but salinity showed a significative difference between LRS and SRS (adjusted p-value < 0.05), with a large magnitude effect of the seasonality (η2 = 0.54). The salinity mean value observed during the study period was 18.28 ± 6.11 PSU. The lowest mean value was observed during the LRS (10.84 ± 0.96 PSU), and the highest mean value observed during the SRS (24.34 ± 0.55 PSU).
Dissolved oxygen (D. O) presented high variability during the study period. The mean D. O value recorded was 5.16 ± 3.34 mg/l. A decrease in oxygen concentration was observed during the LRS with the lowest mean value (2.25 ± 0.91 mg/l) recorded. During the SDS, this concentration increases and the highest mean value (8.78 ± 0.79 mg/l) was recorded. Significant difference of D. O between LRS and SDS was observed (adjusted p-value < 0.05), with a large effect of seasonality (η2 = 0.37).
Chlorophyll-a which provides information on primary productivity was significantly different between LRS and SDS (adjusted p-value < 0.05) also with a large effect of the seasons on the variance (η2 = 0.38). A great variability was observed during the study period. The mean value recorded was 0.159 ± 0.136 mg/l. The increase of primary productivity was observed during the seasons where a relative stability of climate conditions was observed (during the SDS and SRS). The highest concentration was observed during the SDS (0.3 ± 0.06 mg/l), and the lowest concentration observed during the LRS (0.05 ± 0.04 mg/l).
Nutrients (nitrates, nitrites, phosphates and nitrogen ammonia) presented a great variability during the study period in the study area. Nitrate presented a significant difference between LRS and SRS, with a large effect of the seasons (η2 = 0.29). The mean value was 2.13 ± 1.44 mg/l. The lowest mean value (1.39 ± 0.54 mg/l) was recorded during the LDS, and the highest mean value (3.15 ± 2.15 mg/l) was observed during the LRS.
The mean value of nitrites was 0.02 ± 0.017 mg/l during the study period, with lowest mean value observed during the LRS (0.012 ± 0.01mg/l), and the highest during the LDS (0.026 ±0.03 mg/l). Nitrogen ammonia mean value was 0.92 ± 0.18 mg/l, with lowest value (0.46 ± 0.37mg/l) recorded during SDS, and the highest value (1.38 ± 1.19 mg/l) obtained during the LRS.
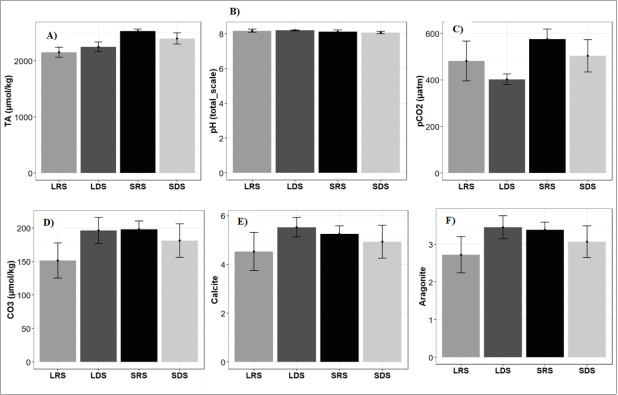
Six variables of the carbonate system were considered in this study: Total Alkalinity (TA), partial pressure in carbon dioxide (pCO2), Hydrogen potential (pH), carbonates ions (CO32-), aragonite saturation state (Ar) and calcite saturation state (Ca). The seasonal variation of these variables is presented in Figure 7. pCO2 presented a significant difference between Kb and Eb sampling stations (adjusted p-value < 0.05) and not between seasons. The others carbonate system variables were not significantly different between sampling stations. However, TA showed significant difference between LRS and SRS (adjusted p-value = 0.034), with a large effect of the seasons on the variance (η2 = 0.35). TA mean value obtained during the sampling period was 2332.65 ± 236.11 µmol/kg, with the lowest mean value (2152.06 ± 222.16 µmol/kg) obtained during the LRS and the highest mean value (2530.47 ± 81.58 µmol/kg) during the SRS (Figure 7A). pH mean value observed during the entire study period was 8.14 ± 0.17, with the highest mean value (8.20 ± 0.05) during the LDS, and the lowest (8.07±0.15) during the SDS (Figure 7B). For pCO2, the mean value was 491.11 ± 150.80 µatm, with a lowest mean value of 402.90 ± 55.7 µatm obtained during the LDS, and the highest 575.98 ± 103.72 µatm during the SRS (Figure 7C). Carbonate’s ions mean value was 181.86 ± 52.78 µmol/kg, with lowest mean value (151.63 ± 64.5 µmol/kg) during the LRS, and the highest mean value (198.04 ± 31.33 µmol/kg) during the SRS. Aragonite saturation state showed a saturated water with a mean value of 3.16 ± 0.89 Ω. The lowest mean value (2.72 ± 1.17Ω) was observed during the LRS, and the highest mean value (3.45 ± 0.74 Ω) during the LDS (Figure 7F). Calcite saturation state mean value was 5.06 ± 1.37 Ω. The lowest mean value (4.52 ± 1.92 Ω) was observed during the LRS, and the highest mean value (5.53 ± 0.96 Ω) during the SDS.
3.4. Influence of Environmental Variables on Zooplankton Abundance
In this analysis, four physicochemical parameters (temperature, salinity, pH, and pCO2) were considered, which we thought could potentially influence the zooplankton abundance, including pH and pCO2 as carbonate system parameters.
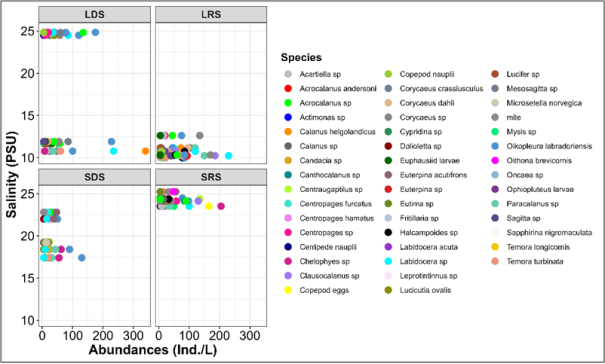
Figure 8 shows the distribution of zooplankton species abundance as a function of salinity trends across the four sampling seasons. The results indicate a greater diversity of species and higher abundance at lower salinity level during the LRS and LDS. The specie Calanus helgolandicus was the most abundant at low salinity in LDS, whilst the specie Labidocera sp appears to be euryhaline, as was present at both low and high salinity levels. In general, abundance decreases as salinity increases.
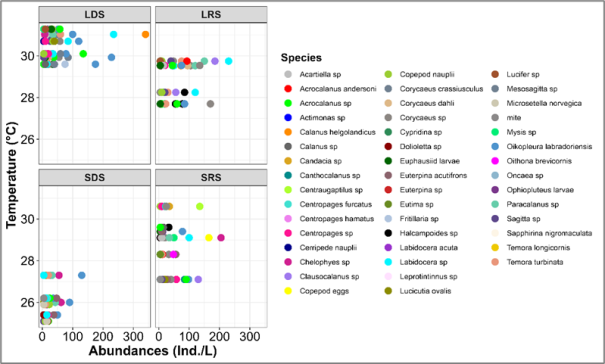
Similarly, Figure 9 shows that species abundance decreases with temperature, with the most abundant species occurring at high temperature.
Figure 7. Seasonal mean values of carbonate system variables.
Table 3. Seasonal and spatial mean values of physicochemical parameters in the study area.

Parameters

Spatial mean values

Seasonal mean values

Kb

Bp

Eb

LRS

LDS

SRS

SDS

Salinity (PSU)

18.1 ± 6.35

17.5 ± 6.27

19.3 ± 6.4

10.84 ±0.96

18.08 ± 7.27

24.34 ± 0.55

19.85 ± 2.10

Temp. (°C)

28.3 ± 2.12

29.1 ± 1.78

28.3 ± 1.78

28.83 ± 0.87

30.44 ± 0.66

29.01 ± 1.2

25.98 ± 0.76

D. O (mg/l)

4.74 ± 3.0

5.11 ± 3.67

5.63 ± 3.73

2.25 ± 0.91

4.50 ± 3.90

5.11 ± 2.91

8.78 ± 0.79

E. C (mS/cm)

29.4 ± 9.66

28.9 ± 9.78

31.7 ± 10.1

18.41 ± 1.50

29.23 ±10.8

39.63 ± 1.43

32.72± 3.63

TDS (g/l)

15.4 ± 5.21

15.0 ± 5.23

16.7 ± 5.89

9.19 ± 0.76

14.61 ± 5.39

20.25 ± 1.14

18.8 ± 2.83

Nitrate (mg/l)

2.34 ± 1.09

2.08 ± 2.23

1.98 ± 0.82

3.15 ± 2.15

1.39 ± 0.54

1.42 ± 1.11

2.55 ± 0.86

Phosphate(mg/l)

1.63 ± 1.50

0.50 ± 0.75

1.66 ± 2.77

2.12 ± 3.19

1.62 ± 1.42

1.23 ± 1.06

0.09 ± 0.15

Chl.a (mg/l)

0.12 ± 0.1

0.23 ± 0.16

0.134 ±0.12

0.053 ± 0.04

0.097 ± 0.15

0.2 ± 0.12

0.3 ± 0.061

Nitrite (mg/l)

0.02 ± 0.015

0.025 ± 0.02

0.02 ± 0.009

0.012 ± 0.01

0.026 ±0.03

0.018 ± 0.01

0.02 ± 0.007

Ammonia (mg/l)

1.07 ± 0.76

0.78 ± 0.97

0.93 ± 1.05

1.38 ± 1.19

1.33 ± 1.09

0.54 ± 0.41

0.46 ± 0.37

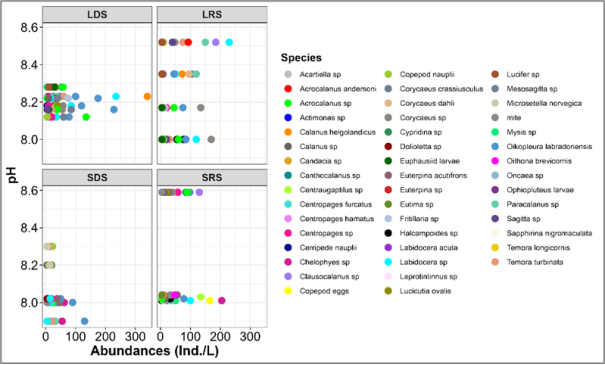
The distribution of species in relation to pH variation (Figure 10) revealed a seasonal influence on distribution, with a decline in species abundance as pH decreased during LDS and LRS. However, during the SDS season, Oikopleura labradoriensis, the most abundant specie during this season, was present at a low pH (< 8), indicating a possible adaptation to significant pH variation. During the SRS season, a clear shift appears in species distribution, with one group of organisms present at a high pH and another, more numerous groups with higher abundances - particularly for Chelophytes sp; in this case too, abundance increase as pH decreases.
Figure 8. Distribution of zooplankton species abundance in relation to seasonal changes in salinity.
Figure 9. Distribution of zooplankton species abundance in relation to seasonal changes in temperature.
Figure 10. Distribution of zooplankton species abundance in relation to seasonal changes in pH.
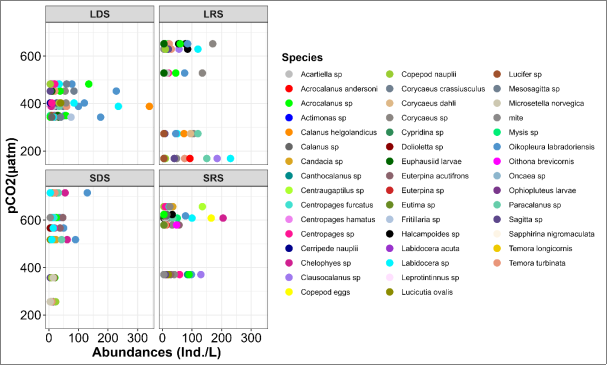
Since there is an inverse relationship between pH and pCO2, meaning that pH decreases as pCO2 increases, the effect on the distribution of organisms also reflects this relationship, with species that are abundant at low pH being abundant at high pCO2 and vice versa, as shown in Figure 11.
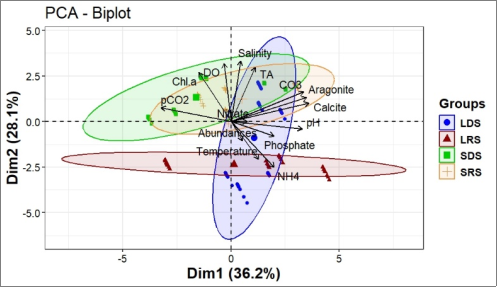
Although the previous figures seem to show a relationship between environmental variables including carbonate system parameters, and zooplankton abundance, Principal Component Analysis (PCA) reveals that, in reality, no single variable determines the variation in zooplankton abundance within the study area (Figure 12). Abundance is probably the result of the combined effect of all environmental factors, the availability of food, and even the presence or absence of predators.
3.5. Analysis of the Vulnerability to Ocean Acidification
The analysis of the vulnerability to ocean acidification of the studied area was based on the calculation of the Coastal Ocean Acidification Vulnerability Index (COAVI), using Exposure (Ei), sensitivity (Si) and adaptation (Ai) factors. The result showed an overall index value of 0.53, corresponding to moderate or intermediate vulnerability to ocean acidification, with exposure (Ei) values of 0.41, sensitivity (Si) value of 0.59 and adaptation (Ai) value of 0.47.
The Ei value obtained indicates that the Kribi area is subject to moderate but significant coastal ocean acidification. This exposure is consistent with a coastal ecosystem subject to multiple sources of CO2 (atmospheric, decomposition of organic matter, biological respiration) and to riverine inputs, naturally more acidic than seawater. Similarly, the Si value indicated moderate sensitivity, meaning that the proportion of zooplankton organisms sensitive to ocean acidification is large enough for a moderate impact, but is already approaching a high level. The ecosystem therefore shows notable sensitivity, noting that both calcifying and non-calcifying organisms react significantly to falling pH, low aragonite saturation and fluctuating chemical conditions. The Ai value indicates a similarly moderate capacity for adaptation, linked mainly to natural mechanisms that can partially mitigate ocean acidification in the Kribi area, notably biological diversity and tolerant zooplankton groups. However, with organic pollution and increasing anthropogenic pressure, this adaptive capacity is fragile and likely to decline rapidly, particularly as very few measures are being taken to promote adaptation or reduce acidification or acidification effects in the area.
In order to identify the areas and periods of greatest vulnerability within the study area, the COAVI index was applied at both a spatial and seasonal scale. Table 4 presents these vulnerability indices.
The results show that the Bp sampling station was the most vulnerable to coastal acidification (COAVI = 0.81 corresponding to high vulnerability), with moderate exposure (Ei=0.55) and high sensitivity (Si=0.73), whilst the rainy seasons (LRS and SRS) are the periods of greatest vulnerability for the ecosystem.
Figure 11. Distribution of zooplankton species abundance in relation to seasonal changes in pCO2.
Figure 12. Biplot of Principal Component Analysis (PCA) of environmental variables and zooplankton abundance in the study area.
Table 4. vulnerability indices at the spatial and seasonal scale in the study area.

Stations

Seasons

Eb

Kb

BP

LRS

LDS

SRS

SDS

Ei

0.46

0.45

0.55

0.67

0.45

0.53

0.47

Si

0.52

0.54

0.73

0.56

0.66

0.70

0.64

Ai

0.47

0.47

0.47

0.47

0.47

0.47

0.47

COAVI

0.51

0.52

0.81

0.76

0.64

0.76

0.64

4. Discussion
4.1. Composition of the Zooplankton Community in the Coastal Waters of Kribi
The pivotal role of zooplankton communities in marine ecosystems for energy transfer from primary producers to pelagic food webs, and their sensitivity to environmental changes explain why they are used as indicator of ecosystem health status. The zooplankton community in this study exhibited a high-level diversity, with a richness index of 45 taxa, and was dominated by copepods at all sampling stations and seasons. The copepod species Clausocalanus sp was the most abundant among the samples, with the majority of individuals observed at the Kb station. The preponderance of copepods has been previously documented in studies conducted along the South coast of Cameroon , and observed in others marine ecosystems of West and North Africa Atlantic coast . This dominance can be attributed to the resilience of copepods to fluctuations in environmental conditions . The Shannon diversity index (H') calculated at both spatial and temporal scales, yielded a high value (˃ 3), indicating that the ecosystem was biologically in good state according to the classification presented by , and the population sems to be well distributed as the Pielou evenness index was also high. These values were higher than those observed by in the South coast of Cameroon. These authors noted low diversity index values during their studies and linked that to the organic pollution and environmental instability. The difference observed maybe due to the fact that one of the research teams carried out their study at the continuum of the Kienke river and ocean. This river flows through an agro-industrial zone and the city of Kribi, carrying numerous pollutants to the sea. The other team realized their study in less than 800 m from the coastline, in an area where the environment is subject to wave dynamics and to the direct influence of waste and pollutants from the shore carried by small rivers that flow into the area, making the physicochemical conditions of the environment unstable. Our stations were situated at about 3km from the shore where conditions are relatively stable, allowing for the diffusion and dilution of pollutant in seawater, promoting the community diversity.
In marine ecosystems, pelagic fish (including small pelagic fish and fish larvae) represent the primary predator of zooplankton . The abundance and diversity of this food source for small pelagic fish, can impact their catch in a giving area . In the southern coastal region of Cameroon, the practice of pelagic fishing plays a significant role in the livelihoods of local communities . The zooplankton collected during our study period in the portion of this coast appears diversified with a dominance of copepods group, the most important prey of fish larvae and small pelagic fishes . This diversity of zooplankton can support the development of planktivorous pelagic fish in the area. The period where small pelagic fish catches is higher in the study area , corresponded to the period of high zooplankton abundance as presented. This suggests that the zooplankton community potentially support the growth of small pelagic and the fishery in our study area, and in turn the local community incomes. But the lowest diversity index recorded during the LRS period compared to the others seasons could also highlighted the effect of planktivorous fishes on selective zooplankton species. However, a long-term study will be necessary to confirm this hypothesis.
4.2. Environmental Characteristics and Their Influence on Zooplankton Abundance and Diversity
The environmental conditions experienced by zooplankton organisms in the southern coast of Cameroon was characterized by the variability of physicochemical variables including carbonate system parameters. The variation of salinity exhibited a consistent pattern across all sampling stations and seasons during the study. The relatively low mean values observed during the LRS indicate that the high precipitation levels and freshwater input from coastal rivers in this period, result in a reduction in salinity within the area. Conversely, during the large dry season, which extends, the strong sunlight favors evaporation, leading to an increase in salinity. During the small rainy season (SRS) which followed the LDS, low precipitation levels and mild weather with the alternance of rainy and sunny days have a negligible impact on salinity levels. This variation of salinity is typical of equatorial region and the Gulf of Guinea . Three distinct groups of zooplankton taxa stand out in response to salinity changes. The first group of organisms was present during low salinity periods (during LRS) and was relatively diversified, with the specie Labidocera sp being particularly prevalent. During the transitional period (SDS), the second group of organisms appears less diversified and less abundant. At higher salinities (SRS and LDS), the third group of organisms was also diversified but demonstrated a lower abundance than the first group. The Shannon diversity index was lowest during the season with low salinity (LRS) showing the potential influence of this variable on the diversity distribution in the area. Studies have showed that, salinity can be considered as one of significant environmental factor influencing the biodiversity, abundance and distribution of zooplankton in coastal ecosystems .
The sea surface temperature exhibited a consistent warm trend, with values consistently above 25°C, in accordance with the typical season pattern. The maximum value was observed during the dry season, with a gradual decline as the weather became more “temperate”, reaching a minimum during the beginning of SDS, which was followed by the onset of the rainy season. Furthermore, have observed a similar variation trend in sea surface temperature in the Gulf of Guinea, which they have linked to precipitation levels over the West Africa. The distribution of zooplankton over the study period in relation to temperature change demonstrated that the majority of identified zooplankton taxa were present at temperature above 25°C. during the SDS, few zooplankton taxa were found below this temperature in a relatively low abundance. In the context of global warming, temperature could affect the abundance, size composition, diversity, distribution of individuals species and assemblages, and trophic efficiency of zooplankton . In this study, we observed that, calanoid copepods species were present at both low and high temperatures, with the greatest abundance occurring at the highest temperatures. This copepod group can be considered as the most adapted taxa to the variation of seawater temperature in the study area and could be an ideal candidate to study the resilience of zooplankton in the context of warming seawater.
The PCA biplot showed an opposite relationship between pH and pCO2 during this study, suggesting a strong negative influence of atmospheric CO2 absorbed by the ocean on the variation of pH. This relationship is at the basis of the ocean acidification process . However, in coastal ocean, additional factors such as nutrient enrichment can also contribute to acidification by releasing CO2 in seawater during their microbial degradation .
Zooplankton observations appears to be abundant and diversified at pH values above 8.00 and low pCO2. Conversely, at low pH or high pCO2, the diversity of zooplankton was observed to decrease in the study area. According to , in a community with high dominance of copepods, the diversity of meso-zooplankton was not affected by pCO2. This effect on their abundance could be species - specific sensitives. , in an experimental study showed that, eggs, early copepodite stages, and adult males and females calanoid copepods were not affected lethally until pCO2 concentrations ≥3000 µatm. There is a growing evidence that the increase in pCO2 and reduced pH in seawater have strong positive or negative effects on the physiology and behavior of marine plankton, which in turn can translate to specie and community-level changes . In this study, we observed that increasing pCO2 and decreasing pH can affect the diversity by reducing the number of taxa, and the abundance of zooplankton community in the study area.
Overall, carbonate system variables showed Spatio-temporal variability in the study area. Such variabilities have been observed in many other regions in the world . The data indicated that the critical threshold for ocean acidification had not been reached in the study area, as the seawater remained saturated with regard to the mean value of aragonite saturation state (Ω ˃ 1). However, a decreasing tendency was observed during the LRS and at Bp sampling station. have obtained similar decreasing tendency of aragonite in some sampling stations in the central Atlantic coastline of Ghana. The Bp station will need to be specifically monitored over the long term in order to determine the mechanism responsible for this drop in aragonite saturation, as this could be critical for calcifying planktonic organisms and other organisms that need calcium carbonate to form their skeletons in these areas.
4.3. Vulnerability of the Coastal Waters of Kribi to Ocean Acidification
The assessment of the vulnerability of the coastal ocean at Kribi was based on three factors: the environment’s exposure to acidification, the sensitivity of organisms, particularly zooplankton and adaptative capacity. Based on these factors, the COAVI index calculation yielded an overall value of 0.53, suggesting moderate vulnerability, characterized by moderate but non negligible chemical exposure, significant biological sensitivity and limited adaptive capacity in the area. These results are consistent with current trends in acidification in tropical coastal waters and the observed ecological effects. The estimated exposure factor (Ei) of 0.41 indicates that the carbonate chemistry in the coastal ocean at Kribi shows signs of disturbance, with pH levels lower than the ocean average and reduced aragonite saturation levels observed during certain periods. This type of signal is well documented in the literature, due to the ocean’s absorption of CO2, which alters the ocean’s chemical characteristics . The hydrography of the area and the input of organic matter and various types of pollutants into the study area could explain the deterioration of the carbonate system’s parameters, particularly the low pH observed during certain periods. In tropical coastal areas in particular, acidification can be exacerbated by local processes such as the inflow of freshwater from coastal rivers, eutrophication or organic respiration . The challenge in our study area remains to distinguish between variations in the carbonate system and pH associated with oceanic CO2 uptake and those caused by factors relate to potential eutrophication. A detailed study of eutrophication in the area, combine with data on the carbonate system, will make it possible to make this distinction.
Although very few of the identified zooplankton organisms are known to be directly affected by ocean acidification through calcification for example , the sensitivity factor (Si) calculated from the overall dataset (Si=0.59) suggests that the physiology of these organisms could be significantly affected. Several studies on planktonic communities in coastal areas have highlighted losses in diversity and alterations in abundance dynamics under acidification conditions . These observations align with the sensitivity observed in the coastal ocean off Kribi. Furthermore, studies on the vulnerability of tropical ecosystems emphasize that the response of biological communities to acidification varies depending on the interaction between pH, temperature, nutrient availability, and other local stresses . In the case of Kribi, multiple stressors (organic pollution, water turbidity, riverine inputs) could interacts with acidification, potentially in a synergistic effect of multiple coastal stressors on biodiversity as demonstrated by . This suggest that the sensitivity of zooplankton in Kribi cannot be interpreted solely as a response to pH, but also as the result of a multitude of complex ecological interactions.
The relatively low value of the adaptive capacity factor (Ai=0.47), reflects the limited environmental and institutional management capabilities to mitigate the effects of OA. Cameroon does not yet have a reliable network for the continuous monitoring of OA capable of producing sufficient data that can be used to implement appropriate environmental management and protection measures to reduce or combat the potential effects of OA on marine ecosystems and strengthen socioeconomic adaptation. According to the southern Atlantic coast of Cameroon (Kribi - Campo) has relatively low adaptive capacity to climate change. The adaptive capacity depends not only on intrinsic biological resilience (species physiology), but also on the robustness of environmental management networks, long-term data, and adaptive management strategies. In Kribi, the lack of systematic monitoring, gaps in urban wastewater treatment, and constant anthropogenic pressure (urbanization, port activities) reduce the capacity to adapt to OA; a vulnerability exacerbated by local communities’ dependance on small-scale fishing and coastal ecosystem services.
The overall vulnerability index confirms that the Kribi coastal zone falls within a vulnerability range that is cause for concern but not yet critical. This status corresponds to a situation where environmental pressures are high enough to cause significant biological and ecological effects, but where there is still room for management and mitigation. The rainy seasons appear to be periods of highest vulnerability, while the Bp sampling station appears to be a potential hotspot for acidification and should be subject to special monitoring.
5. Conclusion
During this study, we observed a high diversity of zooplankton communities in the coastal ocean of the southern Atlantic coast of Cameroon, with a dominance of the copepods group. The environmental conditions experienced by these organisms were highly variable in terms of physicochemical characteristics and carbonate system parameters. Several factors are likely to affect the diversity and abundance of zooplankton in the area. Salinity and temperature could drive selective presence of some taxa in the area, depending on whether these variables are high or low. The same applies to pH and pCO2, which can influence the community diversity. In general, however it is difficult to say precisely in the multi stressors context of coastal ocean, which parameter in particular is the determining factor, given that certain factors can have a selective effect on either diversity or abundance. The COAVI index showed that the area is moderately vulnerable to ocean acidification, while also identifying the rainy seasons as periods of higher risk, and the Bp station as a potential hotspot of acidification. The decrease in pH and the increase in seawater pCO2 due to freshwater inflows and the decomposition of organic matter appear to be the driving factors behind this vulnerability. It is crucial to implement rigorous environmental management policies in the area that will help limit the effects of other factors, such as eutrophication in synergy with acidification, and strengthen the resilience of this ecosystem. The Kribi study contributes to the literature by broadening the scope of local vulnerability assessments in tropical regions, a field that remains relatively understudied experimentally but is crucial for understanding interface between global acidification and local pressures. However, a more comprehensive study is needed - one that takes into account all socioeconomic activities and all biological organisms in the region that may be affected by ocean acidification, in order to obtain a comprehensive understanding of vulnerability.
Abbreviations

LRS

Large Rainy Season

LDS

Large Dry Season

SRS

Small Rainy Season

SDS

Small Dry Season

Acknowledgments
We would like to thank students of the Institute of Fisheries and Aquatic Sciences of the University of Douala (Ebollo N. Victor and Enguene Bertrand) and staffs of the Specialized Research Station on Marine Ecosystems of Kribi for their help in field and laboratory work.
Author Contributions
Ulrich Joel Felicien Bilounga: Conceptualization, Data curation, Formal Analysis, Investigation, Methodology, Visualization, Writing – original draft, Writing – review & editing
Fils Mamert Onana: Conceptualization, Methodology, Supervision, Validation, Writing – review & editing
Antoine Arfao Tamsa: Resources, Validation, Writing – review & editing
Emmanuel Henock Kwambe Dicka: Investigation, Visualization
Marcelle Nathalie Elougou Ndinga: Resources, Validation
Steeve Arnold Fotue Simo: Investigation, Visualization
Thomas Ewoukem Efole: Methodology, Supervision, Validation, Writing – review & editing
Data Availability Statement
The data supporting the outcome of this research work has been reported in this manuscript.
Conflicts of Interest
The authors declare no conflicts of interest.
References
[1] IOC-UNESCO. State of the Ocean Report. Paris: UNESCO-IOC; 2024.
[2] IPCC. Climate Change 2022 - Impacts, Adaptation and Vulnerability: Working Group II Contribution to the Sixth Assessment Report of the Intergovernmental Panel on Climate Change. 1st ed. Cambridge University Press; 2023.
[3] Gao Y, Lai Z-N, Wang G-J, Liu Q-F, Yu E-M. Distribution of Zooplankton Population in Different Culture Ponds from South China. Nature Environment and Pollution Technology 2019; 18.
[4] Rekik A, Guermazi W, Kmiha-Megdiche S, Sellami I, Pagano M, Ayadi H, et al. Spatial variation of summer microphytoplankton and zooplankton communities related to environmental parameters in the coastal area of Djerba Island (Tunisia, Eastern Mediterranean). Medit Mar Sci 2023; 24: 156-72.
[5] Banse K. Zooplankton: Pivotal role in the control of ocean production. ICES Journal of Marine Science 1995; 52: 265-77.
[6] Richardson AJ. In hot water: zooplankton and climate change. ICES Journal of Marine Science 2008; 65: 279-95.
[7] Marshall GMj, Duggan IC. Responses of zooplankton assemblages to environmental variability among brackish coastal ponds, New Zealand. Estuarine, Coastal and Shelf Science 2024; 303: 108804.
[8] Gattuso J-P, Hansson L, editors. Ocean acidification. Oxford ; New York: Oxford University Press; 2011.
[9] Stark JS, Roden NP, Johnstone GJ, Milnes M, Black JG, Whiteside S, et al. Carbonate chemistry of an in-situ free-ocean CO2 enrichment experiment (antFOCE) in comparison to short term variation in Antarctic coastal waters. Sci Rep 2018; 8: 2816.
[10] Widdicombe S, Isensee K, Artioli Y, Gaitán-Espitia JD, Hauri C, Newton JA, et al. Unifying biological field observations to detect and compare ocean acidification impacts across marine species and ecosystems: what to monitor and why. Ocean Sci 2023; 19: 101-19.
[11] Meunier CL, Algueró-Muñiz M, Horn HG, Lange JAF, Boersma M. Direct and indirect effects of near-future pCO2 levels on zooplankton dynamics. Mar Freshwater Res 2017; 68: 373.
[12] Keil KE, Klinger T, Keister JE, McLaskey AK. Comparative Sensitivities of Zooplankton to Ocean Acidification Conditions in Experimental and Natural Settings. Front Mar Sci 2021; 8: 613778.
[13] Vehmaa A, Almén A-K, Brutemark A, Paul A, Riebesell U, Furuhagen S, et al. Ocean acidification challenges copepod reproductive plasticity 2015.
[14] Tilbrook B, Jewett EB, DeGrandpre MD, Hernandez-Ayon JM, Feely RA, Gledhill DK, et al. An Enhanced Ocean Acidification Observing Network: From People to Technology to Data Synthesis and Information Exchange. Front Mar Sci 2019; 6: 337.
[15] Bilounga UJF, Onana FM, Efole E. T. Potential Impacts of Ocean Acidification in Cameroon Marine and Coastal Ecosystems (Central Africa). Academia Letters 2021.
[16] IPCC, editor. Climate change 2007: the physical science basis. Cambridge: Cambridge University press; 2007.
[17] Jones HP, Nickel B, Srebotnjak T, Turner W, Gonzalez-Roglich M, Zavaleta E, et al. Global hotspots for coastal ecosystem-based adaptation. PLoS ONE 2020; 15: e0233005.
[18] Mahu E, Sanko S, Kamara A, Chuku EO, Effah E, Sohou Z, et al. Climate Resilience and Adaptation in West African Oyster Fisheries: An Expert-Based Assessment of the Vulnerability of the Oyster Crassostrea tulipa to Climate Change. Fishes 2022; 7: 205.
[19] Molua E. Climatic trends in Cameroon: implications for agricultural management. Clim Res 2006; 30: 255-62.
[20] Pouokam G, Lemnuy WB. Cameroon Climate Compatible Developement: Cameroon case study 2012.
[21] Onguene R, Pemha E, Lyard F, Du-Penhoat Y, Nkoue G, Duhaut T, et al. Overview of Tide Characteristics in Cameroon Coastal Areas Using Recent Observations. OJMS 2015; 05: 81-98.
[22] Yuan X, Zhang B, Liang R, Wang R, Sun Y. Environmental Impact of the Natural Gas Liquefaction Process: An Example from China. Applied Sciences 2020; 10: 1701.
[23] Harris R. ICES zooplankton methodology manual. San Diego, Calif. London: Academic; 1999.
[24] Santhanam P, Begum A, Pachiappan P. Basic and Applied Zooplankton Biology. Singapore: Springer Singapore; 2019.
[25] Dickson AG, Sabine CL, Christian JR, Bargeron CP, North Pacific Marine Science Organization, editors. Guide to best practices for ocean CO2 measurements. Sidney, BC: North Pacific Marine Science Organization; 2007.
[26] Pimenta A, Grear J. Guidelines for Measuring Changes in Seawater pH and Associated Carbonate Chemistry in Coastal Environments of the Eastern United States 2018; EPA/600/R-17/483: 59.
[27] Dickson AG. Part 1: Seawater carbonate chemistry. Guide to best practices for ocean acidification research and data reporting, Publications Office of the European Union; 2010, p. 36.
[28] ICOS (Ocean Thematic Centre). Calculation uncertainty of pCO2 from discrete samples of TA, DIC, and pH 2018.
[29] Pierrot D, Lewis E, Wallace DWR. MS Excel Program Developed for CO2 System Calculations 2006.
[30] Millero FJ, Graham TB, Huang F, Bustos-Serrano H, Pierrot D. Dissociation constants of carbonic acid in seawater as a function of salinity and temperature. Marine Chemistry 2006; 100: 80-94.
[31] Dickson AG. Standard potential of the reaction: AgCl(s) +iH(g) = Ag(s) + HCl(aq), and the standard acidity constant of the ion HSO4- in synthetic sea water from 273.15 to 318.15 K. Jounal of Chemical Thermodynamics 1990; 22: 113-27.
[32] Uppström LR. The boron/chlorinity ratio of deep-sea water from the Pacific Ocean. Deep Sea Research 1974; 21: 161-2.
[33] Al-Yamani FY, Skryabin V, Gubanova A, Khvorov S, Prusova I. Marine Zooplankton Practical Guide for the Northwestern Arabian Coast. vol. 2. First Edition. Kuwait: Kuwait Institute for Scientific Research; 2011.
[34] Conway DV, White RG, Hugues-Dit-Ciles J, Gallienne CP, Robins DB. Guide to the coastal and surface zooplankton of the south-western Indian ocean. Marine Biological Association of the United Kingdom 2003; Occasional Publication.
[35] Guglielmo L, Ianora A, editors. Atlas of Marine Zooplankton Straits of Magellan: Amphipods, Euphausiids, Mysids, Ostracods, and Chaetognaths. Berlin, Heidelberg: Springer Berlin Heidelberg; 1997.
[36] Johnson WS. Zooplankton of the Atlantic and Gulf coasts: a guide to their identification and ecology. Baltimore: Johns Hopkins University Press; 2005.
[37] Khelifi-Touhami, Meriem, Ounissi, Makhlouf. Paracalanus Boeck, 1864. ICES Identification Leaflets for Plankton; 2023.
[38] Razouls C, Desreumaux N, Kouwenberg J, Bovée F. Biodiversité des Copépodes planctoniques marins (morphologie, répartition géographique et données biologiques) 2023.
[39] Slotwinski A, Coman F, Richardson AJ. Introductory Guide to Zooplankton Identification 2014.
[40] World Register of Marine Species. 2023.
[41] Tajam J, Rosmee NH, Ishak MAM, Saleh SH, Tan ASH, Mokhtar M, et al. Development of a Coastal Ocean Acidification Vulnerability Index (COAVI). JTHEM 2025; 10: 77-96.
[42] Stewart‐Sinclair PJ, Last KS, Payne BL, Wilding TA. A global assessment of the vulnerability of shellfish aquaculture to climate change and ocean acidification. Ecology and Evolution 2020; 10: 3518-34.
[43] Evariste FF, Denis Jean S, Victor K, Claudia M. Assessing climate change vulnerability and local adaptation strategies in adjacent communities of the Kribi-Campo coastal ecosystems, South Cameroon. Urban Climate 2018; 24: 1037-51.
[44] Tchatchouang Chougong D, Mama AC, Nkwelle Ngappe CN, Semwa G, Ekoa Bessa AZ. Seawater and sediment quality assessment around the Port of Kribi, Cameroon, south Atlantic Coast. Estuarine, Coastal and Shelf Science 2026: 110048.
[45] Paterne MA, Ngum KMM-A, Pierre KS, Malquaire KPR, Mimba ME, Anne-Eunice B-C, et al. Monitoring and Environmental Assessment of Seawater in West Central Africa: Case of the Kribi Industrial and Urban Port Complex in Cameroon, Guinea Gulf. GEP 2021; 09: 167-83.
[46] Jørgensen SE, Xu L, Costanza R. Handbook of Ecological Indicators for Assessment of Ecosystem Health, Second Edition 2010.
[47] R Core Team. R: A language and environment for statistical computing 2024.
[48] Essomba Biloa RE, Vivien NEO, Polycarpe TKR, Bertrand SNP, Siméon T, Mamert OF, et al. Zooplankton Dynamics of the Kienke Estuary (Kribi, South Region of Cameroon): Importance of Physico-Chemical Parameters. OJE 2021; 11: 837-69.
[49] Zambo GB, Nanfack Dogmo R, Owona Edoa FD, Kouedeum Kueppo E, Sob Nangou PB, Christophe P, et al. Spatiotemporal distribution of zooplankton in relation to some abiotic variables in the waters of the Kribian Atlantic coast (South Cameroon). World J Adv Res Rev 2023; 17: 1256-70.
[50] Aka NM, Etile RN, Joany T, N’Da K. Peuplement zooplanctonique du plateau continental ivoirien: diversité, abondance et biomasse. Int J Bio Chem Sci 2018; 12: 129.
[51] Berraho A, Abdelouahab H, Baibai T, Charib S, Larissi J, Agouzouk A, et al. Short-term variation of zooplankton community in Cintra Bay (Northwest Africa). Oceanologia 2019; 61: 368-83.
[52] Akodogbo HH, Dossou-Sognon FU, Ouinsou FT, Avocegan TT, Kouglo JP, Okpeitcha OV, et al. Tidal Impacts on Zooplankton Dynamics in a Major Ocean-Lagoon Channel: Insights from a 25-Hour Intensive Survey in the Cotonou Channel, Benin. JMSE 2024; 12: 1519.
[53] Kornilovs G. Fish and zooplankton interaction in the Central Baltic Sea. ICES Journal of Marine Science 2001; 58: 579-88.
[54] Pitchaikani SJ, Lipton AP. Seasonal variation of zooplankton and pelagic fish catch in the fishing grounds off Tiruchendur coast, Gulf of Mannar, India. Ecohydrology & Hydrobiology 2015; 15: 89-100.
[55] Nsame-Bile O, Kottè-Mapoko Ernest Flavien, Ebonji Seth Rodrigue, Semengue Pierre Paul, Amungwa Ivan Tabikam, Priso Richard Jules. Evaluating the sustainability of fishery resources and fishing gears: Case study of Ngoyè and Elabè, Kribi, South Cameroon. Int J Fish Aquat Stud 2023; 11: 57-64.
[56] Ebango Ngando N, Mbappe Nsomba Regis Christian, Liming Song, Njomoue Pandong Achille, Chenhong Li, Tomedi Eyango Minette. Catch statistics from artisanal marine fishing: A case of the south coast. African Journal of Fisheries Sciences 2021; 9: 001-13.
[57] Turner JT. The Importance of Small Planktonic Copepods and Their Roles in Pelagic Marine Food Webs. Zoological Studies 2004; 43: 255-66.
[58] Berger H, Treguier AM, Perenne N, Talandier C. Dynamical contribution to sea surface salinity variations in the eastern Gulf of Guinea based on numerical modelling. Clim Dyn 2014; 43: 3105-22.
[59] Nasreen. Ocean Salinity. International Journal for Modern Trends in Science and Technology 2022; 8: 296-302.
[60] Yuan D, Chen L, Luan L, Wang Q, Yang Y. Effect of Salinity on the Zooplankton Community in the Pearl River Estuary. J Ocean Univ China 2020; 19: 1389-98.
[61] Santhanam P, Perumal P. Diversity of zooplankton in Parangipettai coastal waters, southeast coast of India 2003; J. mar. biol. Ass. India, 45 (2): 144 - 152.
[62] Helenius LK, Leskinen E, Lehtonen H, Nurminen L. Spatial patterns of littoral zooplankton assemblages along a salinity gradient in a brackish sea: A functional diversity perspective. Estuarine, Coastal and Shelf Science 2017; 198: 400-12.
[63] Odekunle TO, Eludoyin AO. Sea surface temperature patterns in the Gulf of Guinea: their implications for the spatio‐temporal variability of precipitation in West Africa. Intl Journal of Climatology 2008; 28: 1507-17.
[64] Brucet S, Boix D, Quintana XD, Jensen E, Nathansen LW, Trochine C, et al. Factors influencing zooplankton size structure at contrasting temperatures in coastal shallow lakes: Implications for effects of climate change. Limnology & Oceanography 2010; 55: 1697-711.
[65] Friedrich T, Timmermann A, Abe-Ouchi A, Bates NR, Chikamoto MO, Church MJ, et al. Detecting regional anthropogenic trends in ocean acidification against natural variability. Nature Climate Change 2012; 2: 167-71.
[66] Thor P, Dupont S. Ocean acidification. Handbook on Marine Environment Protection Science, Impacts and Sustainable Management 2018; Chap 3.2: 24.
[67] Wallace RB, Baumann H, Grear JS, Aller RC, Gobler CJ. Coastal ocean acidification: The other eutrophication problem. Estuarine, Coastal and Shelf Science 2014; 148: 1-13.
[68] Algueró-Muñiz M, Alvarez-Fernandez S, Thor P, Bach LT, Esposito M, Horn HG, et al. Ocean acidification effects on mesozooplankton community development: Results from a long-term mesocosm experiment. PLoS ONE 2017; 12: e0175851.
[69] Cripps G, Lindeque P, Flynn KJ. Have we been underestimating the effects of ocean acidification in zooplankton? Glob Change Biol 2014; 20: 3377-85.
[70] Wei Y, Ding D, Gu T, Jiang T, Qu K, Sun J, et al. Different responses of phytoplankton and zooplankton communities to current changing coastal environments. Environmental Research 2022; 215: 114426.
[71] Enochs IC, Manzello DP, Jones PR, Stamates SJ, Carsey TP. Seasonal Carbonate Chemistry Dynamics on Southeast Florida Coral Reefs: Localized Acidification Hotspots from Navigational Inlets. Front Mar Sci 2019; 6: 160.
[72] Jones EM, Renner AHH, Chierici M, Wiedmann I, Lødemel HH, Biuw M. Seasonal dynamics of carbonate chemistry, nutrients and CO2 uptake in a sub-Arctic fjord. Elementa: Science of the Anthropocene 2020; 8: 41.
[73] McGrath T, McGovern E, Gregory C, Cave RR. Local drivers of the seasonal carbonate cycle across four contrasting coastal systems. Regional Studies in Marine Science 2019; 30: 100733.
[74] Kwame Kpaliba R, Mbage B. Analysis of Carbonate Chemistry Parameters and Impact of Anthropogenic CO2 On Ocean Acidification In Selected Coastline Sites Of Ghana. IJFMR 2024; 6: 17464.
[75] Birchenough S, Williamson P, Turley C. Future of the sea: ocean acidification. Foresight, Government Office for Science 2017.
[76] Alongi D. Vulnerability and Resilience of Tropical Coastal Ecosystems to Ocean Acidification. Examines Mar Biol Oceanogr2020; 3: 15.
[77] Wang M, Jeong C-B, Lee YH, Lee J-S. Effects of ocean acidification on copepods. Aquatic Toxicology 2018; 196: 17-24.
[78] Garrard SL, Hunter RC, Frommel AY, Lane AC, Phillips JC, Cooper R, et al. Biological impacts of ocean acidification: a postgraduate perspective on research priorities. Mar Biol 2013; 160: 1789-805.
[79] Baumann H. Experimental assessments of marine species sensitivities to ocean acidification and co-stressors: how far have we come? Can J Zool 2019; 97: 399-408.
[80] Krishna S, Lemmen C, Örey S, Rehren J, Pane JD, Mathis M, et al. Interactive effects of multiple stressors in coastal ecosystems. Front Mar Sci 2025; 11: 1481734.
Cite This Article
  • APA Style

    Bilounga, U. J. F., Onana, F. M., Tamsa, A. A., Dicka, E. H. K., Ndinga, M. N. E., et al. (2026). Assessment of the Vulnerability of the Kribi Coastal Zone (South Cameroon) to Ocean Acidification Based on Zooplankton and Carbonate Chemistry. Journal of Water Resources and Ocean Science, 15(5), 177-197. https://doi.org/10.11648/j.wros.20261505.11

    Copy | Download

    ACS Style

    Bilounga, U. J. F.; Onana, F. M.; Tamsa, A. A.; Dicka, E. H. K.; Ndinga, M. N. E., et al. Assessment of the Vulnerability of the Kribi Coastal Zone (South Cameroon) to Ocean Acidification Based on Zooplankton and Carbonate Chemistry. J. Water Resour. Ocean Sci. 2026, 15(5), 177-197. doi: 10.11648/j.wros.20261505.11

    Copy | Download

    AMA Style

    Bilounga UJF, Onana FM, Tamsa AA, Dicka EHK, Ndinga MNE, et al. Assessment of the Vulnerability of the Kribi Coastal Zone (South Cameroon) to Ocean Acidification Based on Zooplankton and Carbonate Chemistry. J Water Resour Ocean Sci. 2026;15(5):177-197. doi: 10.11648/j.wros.20261505.11

    Copy | Download

  • @article{10.11648/j.wros.20261505.11,
      author = {Ulrich Joel Felicien Bilounga and Fils Mamert Onana and Antoine Arfao Tamsa and Emmanuel Henock Kwambe Dicka and Marcelle Nathalie Elougou Ndinga and Steeve Arnold Fotue Simo and Thomas Ewoukem Efole},
      title = {Assessment of the Vulnerability of the Kribi Coastal Zone (South Cameroon) to Ocean Acidification Based on Zooplankton and Carbonate Chemistry},
      journal = {Journal of Water Resources and Ocean Science},
      volume = {15},
      number = {5},
      pages = {177-197},
      doi = {10.11648/j.wros.20261505.11},
      url = {https://doi.org/10.11648/j.wros.20261505.11},
      eprint = {https://article.sciencepublishinggroup.com/pdf/10.11648.j.wros.20261505.11},
      abstract = {Assessing the vulnerability of a coastal area to an anthropogenic factor is crucial for developing adaptation or mitigation strategies. As other countries, Cameroon is exposed to ocean acidification (OA), but very little is known about the extent of its vulnerability. This study aim was to assess the vulnerability of the coastal ocean ecosystem of Kribi (Southern Cameroon) to ocean acidification. Thus, simultaneous monitoring of carbonate system parameters, zooplankton communities, and others environmental variables was conducted in the area between September 2021 and August 2022. Three monitoring stations and a seasonal sampling strategy were established to understand organism’s exposition to changes in the carbonate chemistry and OA. Seawater physicochemical parameters were measured in situ using a calibrated water quality multimeter probe. Nutrients, chlorophyll-a, and total alkalinity (TA) were measured in the laboratory using appropriates methods, with water samples for TA analysis fixed using mercuric chloride (HgCl2). Based on the pH, TA, salinity, and temperature values, the others parameters of the carbonate system were calculated using the CO2SYS_Xls program. Zooplankton was collected at the surface with a 64-micron plankton net and fixed in 5% formaldehyde, then transported to the laboratory for counting and identification. The Coastal Ocean Acidification Vulnerability Index (COAVI) was then used to determine the area’s vulnerability level. As results, 45 zooplankton species, belonging to 7 phylum and 32 families were identified. Copepod was the dominant group in all sampling stations during all the seasons. Environmental conditions were characterized by high temperature (28.56 ± 1.85°C) and a salinity that varied according to the rainfall. The carbonate system indicates that the critical threshold of OA was not reached in the area, as seawater remained saturated with respect to aragonite and calcite saturation (Ω ˃ 1). Although, lowest value of pH, aragonite and calcite were observed during the small and large rainy seasons. Low pH and high pCO2 values were accompanied by a drop in diversity, while salinity variation drives selective presence of some taxa in the area. The COAVI index showed an overall value of 0.53, indicating moderate vulnerability to OA in the study area. Station Bp, with an index of 0.81 was the most vulnerable, while the rainy seasons, with an index of 0.76 are at the highest risk. The study highlighted the area’s vulnerability to OA, which calls for raising awareness and developing local environmental management strategies.},
     year = {2026}
    }
    

    Copy | Download

  • TY  - JOUR
    T1  - Assessment of the Vulnerability of the Kribi Coastal Zone (South Cameroon) to Ocean Acidification Based on Zooplankton and Carbonate Chemistry
    AU  - Ulrich Joel Felicien Bilounga
    AU  - Fils Mamert Onana
    AU  - Antoine Arfao Tamsa
    AU  - Emmanuel Henock Kwambe Dicka
    AU  - Marcelle Nathalie Elougou Ndinga
    AU  - Steeve Arnold Fotue Simo
    AU  - Thomas Ewoukem Efole
    Y1  - 2026/09/15
    PY  - 2026
    N1  - https://doi.org/10.11648/j.wros.20261505.11
    DO  - 10.11648/j.wros.20261505.11
    T2  - Journal of Water Resources and Ocean Science
    JF  - Journal of Water Resources and Ocean Science
    JO  - Journal of Water Resources and Ocean Science
    SP  - 177
    EP  - 197
    PB  - Science Publishing Group
    SN  - 2328-7993
    UR  - https://doi.org/10.11648/j.wros.20261505.11
    AB  - Assessing the vulnerability of a coastal area to an anthropogenic factor is crucial for developing adaptation or mitigation strategies. As other countries, Cameroon is exposed to ocean acidification (OA), but very little is known about the extent of its vulnerability. This study aim was to assess the vulnerability of the coastal ocean ecosystem of Kribi (Southern Cameroon) to ocean acidification. Thus, simultaneous monitoring of carbonate system parameters, zooplankton communities, and others environmental variables was conducted in the area between September 2021 and August 2022. Three monitoring stations and a seasonal sampling strategy were established to understand organism’s exposition to changes in the carbonate chemistry and OA. Seawater physicochemical parameters were measured in situ using a calibrated water quality multimeter probe. Nutrients, chlorophyll-a, and total alkalinity (TA) were measured in the laboratory using appropriates methods, with water samples for TA analysis fixed using mercuric chloride (HgCl2). Based on the pH, TA, salinity, and temperature values, the others parameters of the carbonate system were calculated using the CO2SYS_Xls program. Zooplankton was collected at the surface with a 64-micron plankton net and fixed in 5% formaldehyde, then transported to the laboratory for counting and identification. The Coastal Ocean Acidification Vulnerability Index (COAVI) was then used to determine the area’s vulnerability level. As results, 45 zooplankton species, belonging to 7 phylum and 32 families were identified. Copepod was the dominant group in all sampling stations during all the seasons. Environmental conditions were characterized by high temperature (28.56 ± 1.85°C) and a salinity that varied according to the rainfall. The carbonate system indicates that the critical threshold of OA was not reached in the area, as seawater remained saturated with respect to aragonite and calcite saturation (Ω ˃ 1). Although, lowest value of pH, aragonite and calcite were observed during the small and large rainy seasons. Low pH and high pCO2 values were accompanied by a drop in diversity, while salinity variation drives selective presence of some taxa in the area. The COAVI index showed an overall value of 0.53, indicating moderate vulnerability to OA in the study area. Station Bp, with an index of 0.81 was the most vulnerable, while the rainy seasons, with an index of 0.76 are at the highest risk. The study highlighted the area’s vulnerability to OA, which calls for raising awareness and developing local environmental management strategies.
    VL  - 15
    IS  - 5
    ER  - 

    Copy | Download

Author Information
  • Postgraduate School for Pure and Applied Sciences, University of Douala, Douala, Cameroon;Specialized Research Station on Marine Ecosystems, Agricultural Research Institute for Development, Kribi, Cameroon

  • Department of Aquatic Ecosystems Management, Higher National School of Agronomy Halieutics and Veterinary Medicine, Douala, Cameroon
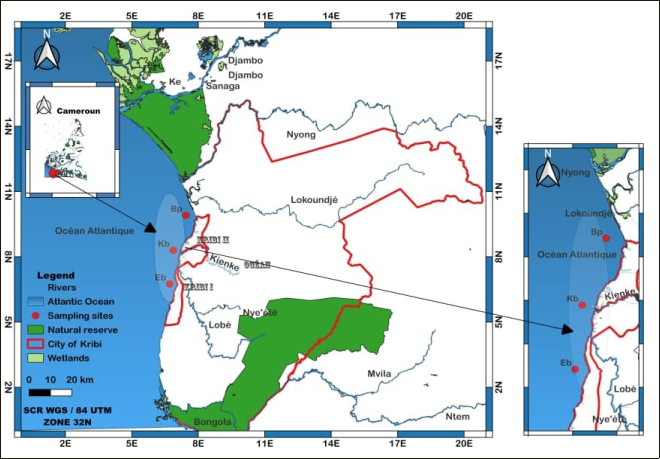
  • Faculty of Sciences, University of Yaounde 1, Yaounde, Cameroon

  • Specialized Research Station on Marine Ecosystems, Agricultural Research Institute for Development, Kribi, Cameroon

  • Department of Aquatic Ecosystems Management, Higher National School of Agronomy Halieutics and Veterinary Medicine, Douala, Cameroon

  • Specialized Research Station on Marine Ecosystems, Agricultural Research Institute for Development, Kribi, Cameroon

  • Postgraduate School for Pure and Applied Sciences, University of Douala, Douala, Cameroon;Department of Aquatic Ecosystems Management, Higher National School of Agronomy Halieutics and Veterinary Medicine, Douala, Cameroon

  • Abstract
  • Keywords
  • Document Sections

    1. 1. Introduction
    2. 2. Materials and Methods
    3. 3. Results
    4. 4. Discussion
    5. 5. Conclusion
    Show Full Outline
  • Abbreviations
  • Acknowledgments
  • Author Contributions
  • Data Availability Statement
  • Conflicts of Interest
  • References
  • Cite This Article
  • Author Information